Travel & Tourism Development Index 2026


Technical notes and methodology
Appendix A: Travel & Tourism Development Index methodology
This section provides details about the methodology of the 2026 edition of the Travel & Tourism Development Index (TTDI). It comprises the following parts:
- Composition and calculation
- Indicator and country selection
- Indicator list and details
- Index changes and comparability
Composition and calculation
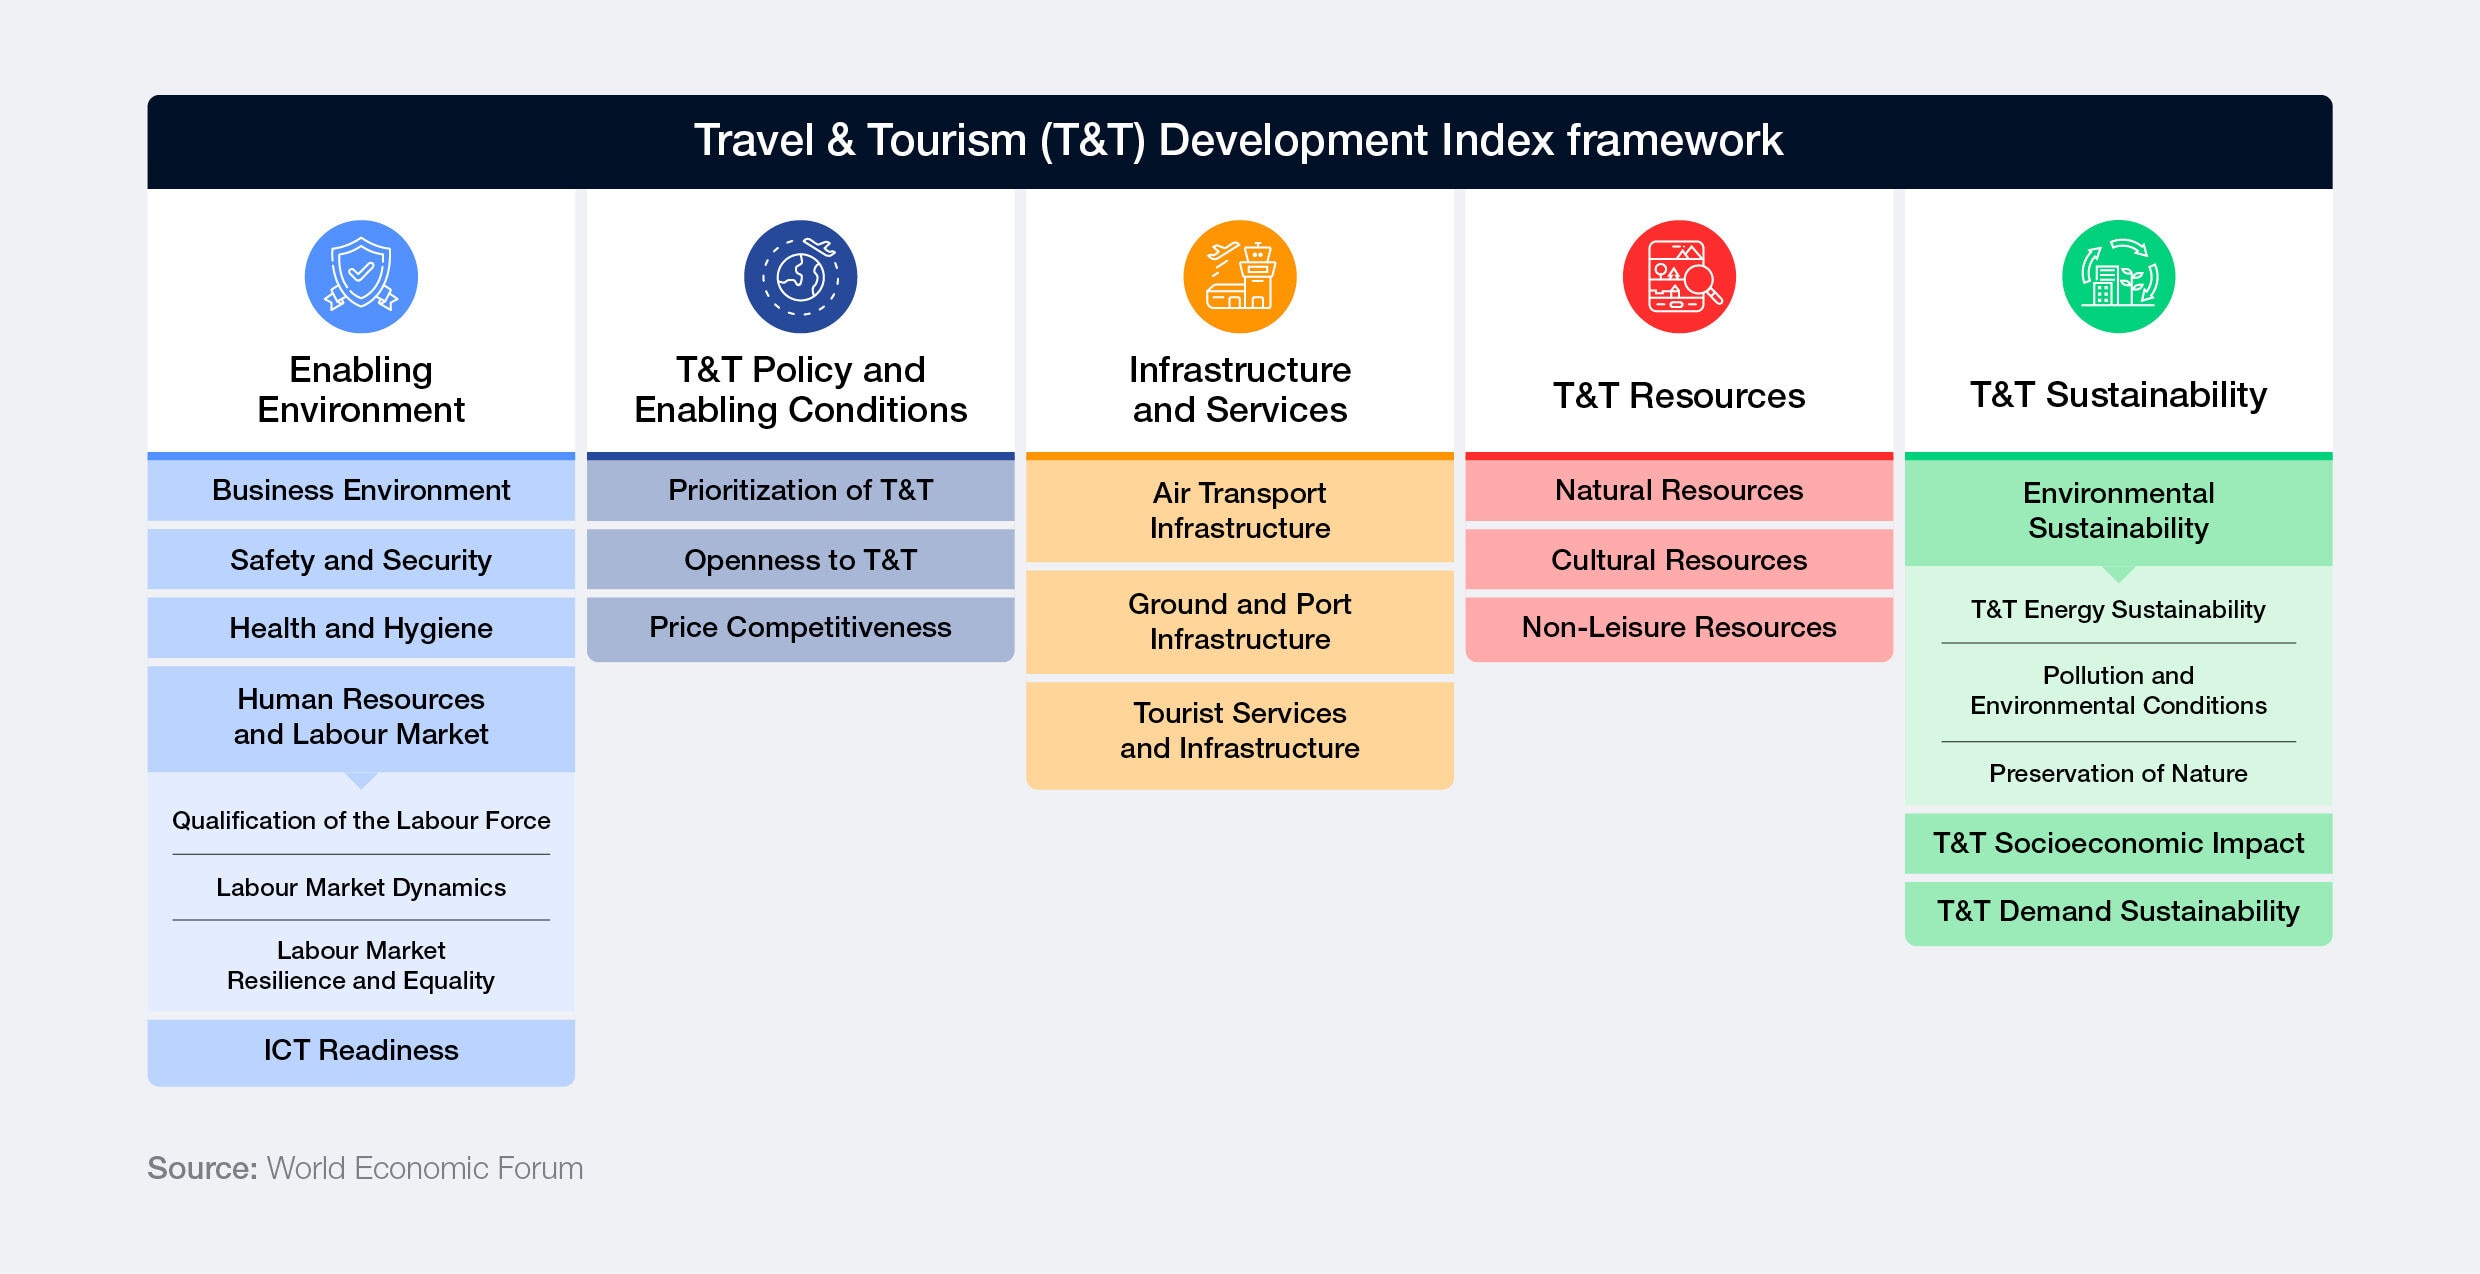
The TTDI structure (see Figure A1) is composed of 17 pillars organized into five dimensions:
A. Enabling Environment (five pillars): 1. Business Environment; 2. Safety and Security; 3. Health and Hygiene; 4. Human Resources and Labour Market; 5. ICT Readiness
B. T&T Policy and Enabling Conditions (three pillars): 6. Prioritization of T&T; 7. Openness to T&T; 8. Price Competitiveness
C. Infrastructure and Services (three pillars): 9. Air Transport Infrastructure; 10. Ground and Port Infrastructure; 11. Tourist Services and Infrastructure
D. T&T Resources (three pillars): 12. Natural Resources; 13. Cultural Resources; 14. Non- Leisure Resources
E. T&T Sustainability (three pillars): 15. Environmental Sustainability; 16. T&T Socioeconomic Impact; 17. T&T Demand Sustainability
Figure A1: Framework

These 17 pillars comprise 102 indicators that are calculated based on data derived from the Executive Opinion Survey (the survey) as well as quantitative data from other sources. The survey data is derived from responses to the World Economic Forum’s Executive Opinion Survey and ranges in value from 1 (worst) to 7 (best). TTDI 2026 results reflect the latest available data at the time of collection (May 2026).
Hard data (non-survey data) was collected from various sources, which are described in Appendix B. Data used in the calculation of the TTDI can be found by visiting the online version of the Travel & Tourism Development Index (TTDI) 2026.
The TTDI is calculated as an average (arithmetic mean) of the 17 component pillar averages (arithmetic means). While figures for the five dimensions are provided, they are used for categorization and presentation purposes only. Each of the pillars is calculated as an unweighted average of the individual component variables. Note that the Human Resources and Labour Market pillar is the unweighted average of its three subpillars: Qualification of the Labour Force, Labour Market Dynamics and Labour Market Resilience and Equality. Likewise, the Environmental Sustainability pillar is the unweighted average of its three subpillars: T&T Energy Sustainability, Pollution and Environmental Conditions and Preservation of Nature.
Hard data indicators used in the TTDI are normalized to a 1-to-7 scale in order to align them with the Executive Opinion Survey’s results. The standard formula for converting each hard data indicator to the 1-to-7 scale is:


The sample minimum and sample maximum are the lowest and highest scores of the overall sample, respectively. For those hard data indicators for which a higher value indicates a worse outcome (e.g. fuel price levels), the report team rely on a normalization formula that, in addition to converting the series to a 1-to-7 scale, reverses it, so that 1 and 7 still correspond to the worst and best, respectively:


However, in many cases, adjustments are made to figures used for sample minimum and sample maximum to account for issues such as outliers. See Table A1 for further details.
Indicator and country selection
To be selected for the TTDI, indicators need to meet the following criteria:
- Relevance: The indicator must be an acceptable metric for the concept that is being covered.
- Country coverage: Timely indicator data must be available for the majority of economies covered by the TTDI. In most cases, this means coverage exceeds 100 economies.
- Comparability: The indicator data must be comparable among the various economies covered and throughout its time series.
- Update frequency: The indicator must be regularly updated for the foreseeable future.
- Source quality and objectivity: The indicator must come from a reputable and objective source. In this regard, common sources include international organizations such as the World Bank and UN Tourism. To help with comparability, attempts are made to retrieve as much data as possible for a particular indicator from one source.
For data that is missing or is more than 10 years old, the following steps are taken:
- First, research is conducted to find an alternative non-government source.
- If no non-government source is found, publicly available government data is collected. However, the respective government is never informed of this action to avoid creating an unfair advantage or increase bias.
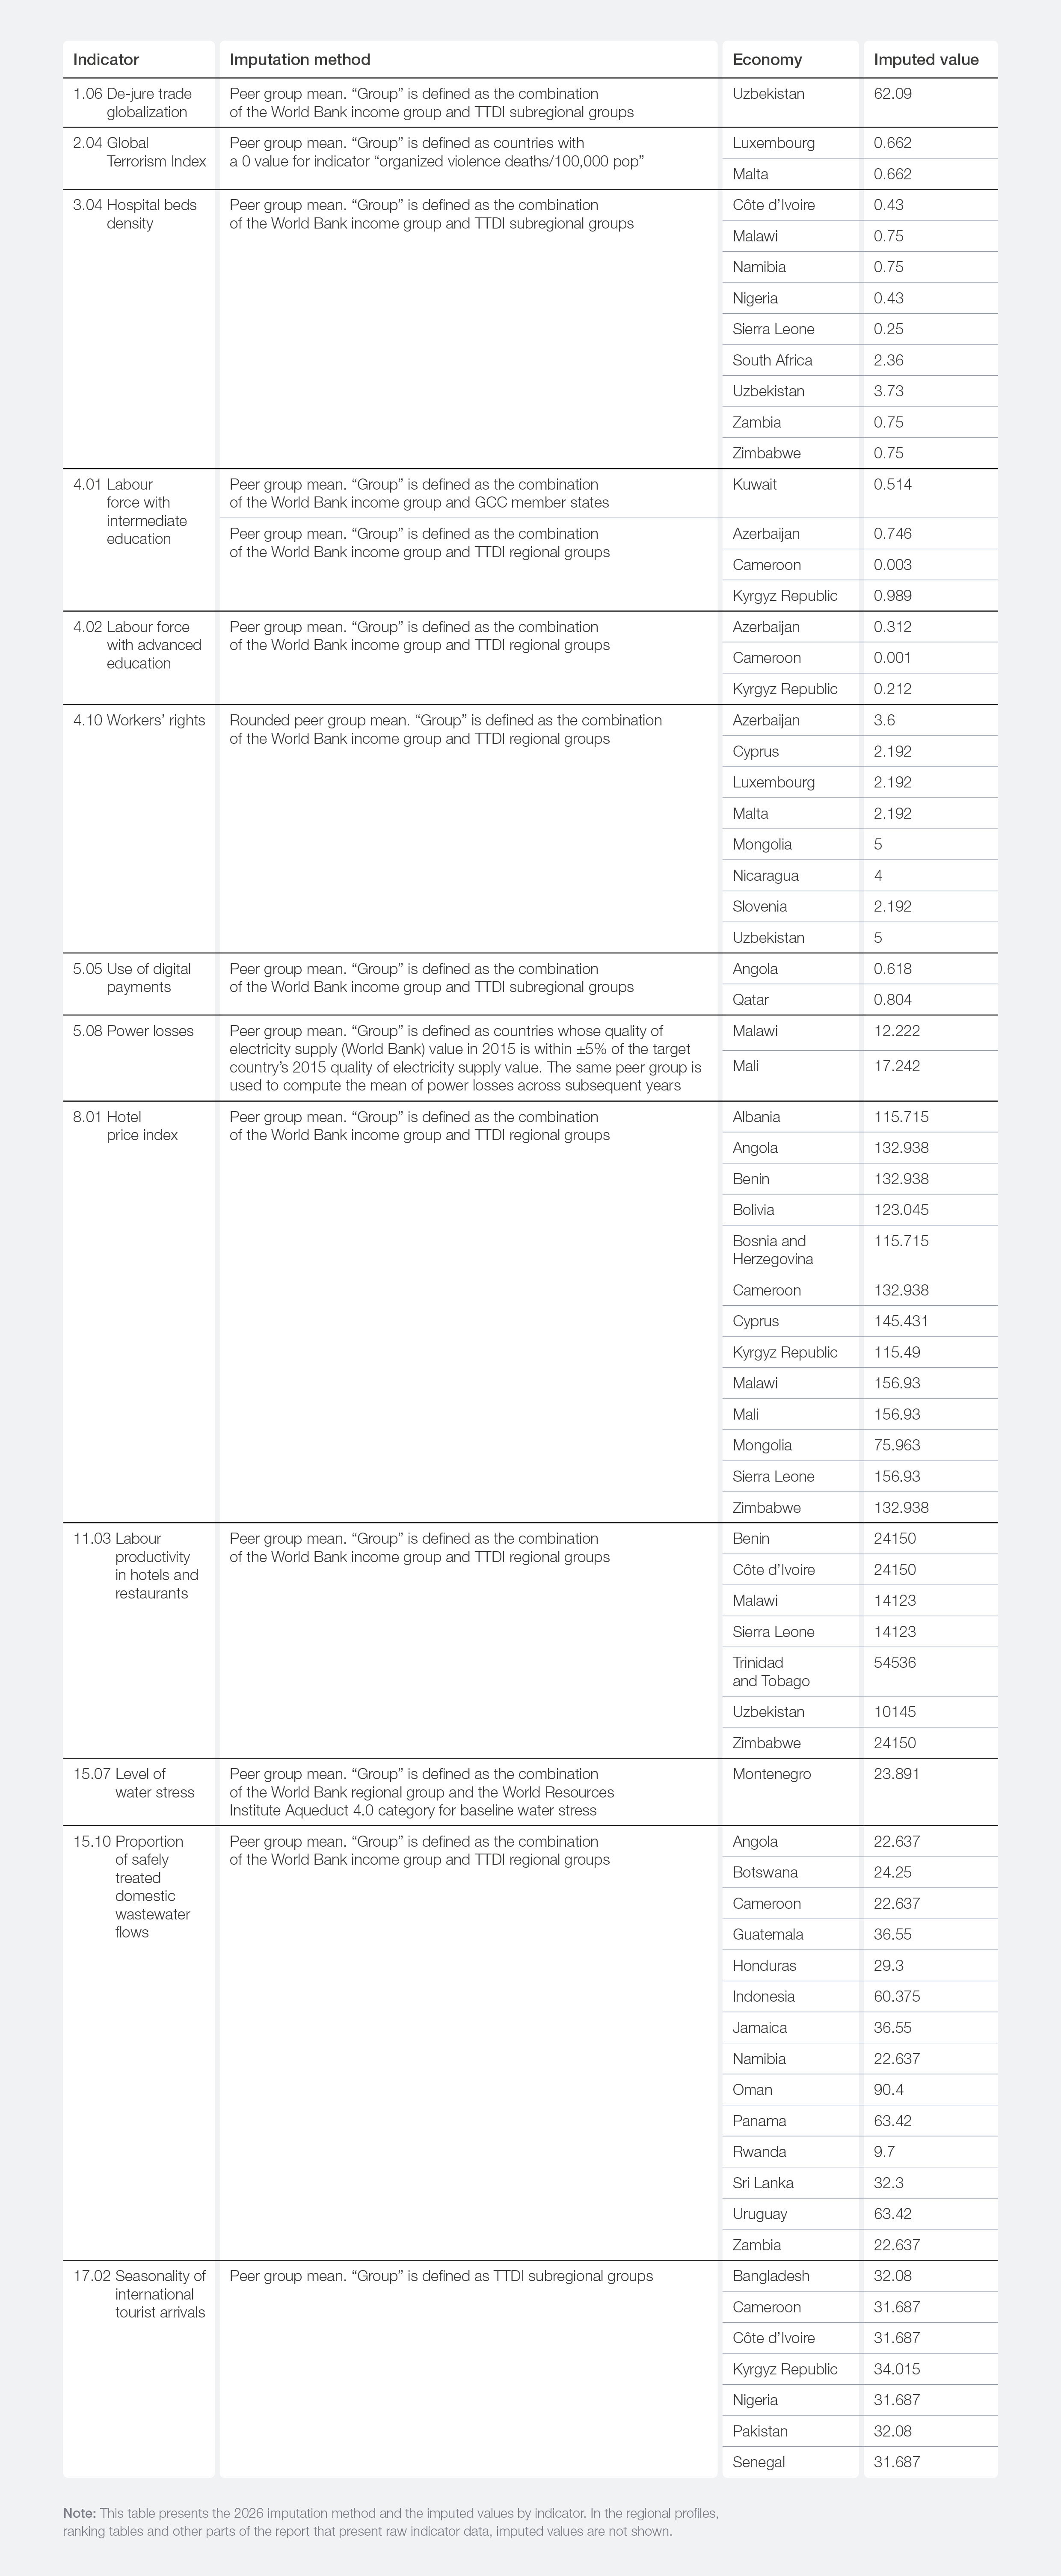
- In the case that no data is found using the above two steps, the data is imputed. Please see a list of imputed data in Table A2.
For an economy to be included in the TTDI, it needs to:
- Be included in at least one of the latest three Executive Opinion Surveys as this survey accounts for a large share of indicators
- Not have missing data for 10% or more of total indicators or 20–33% of indicators within any particular pillar (share depends on the pillar)
- Not be partaking in a conflict that generates enough material damage to make the indicators outdated
Table A1: Indicator list and details
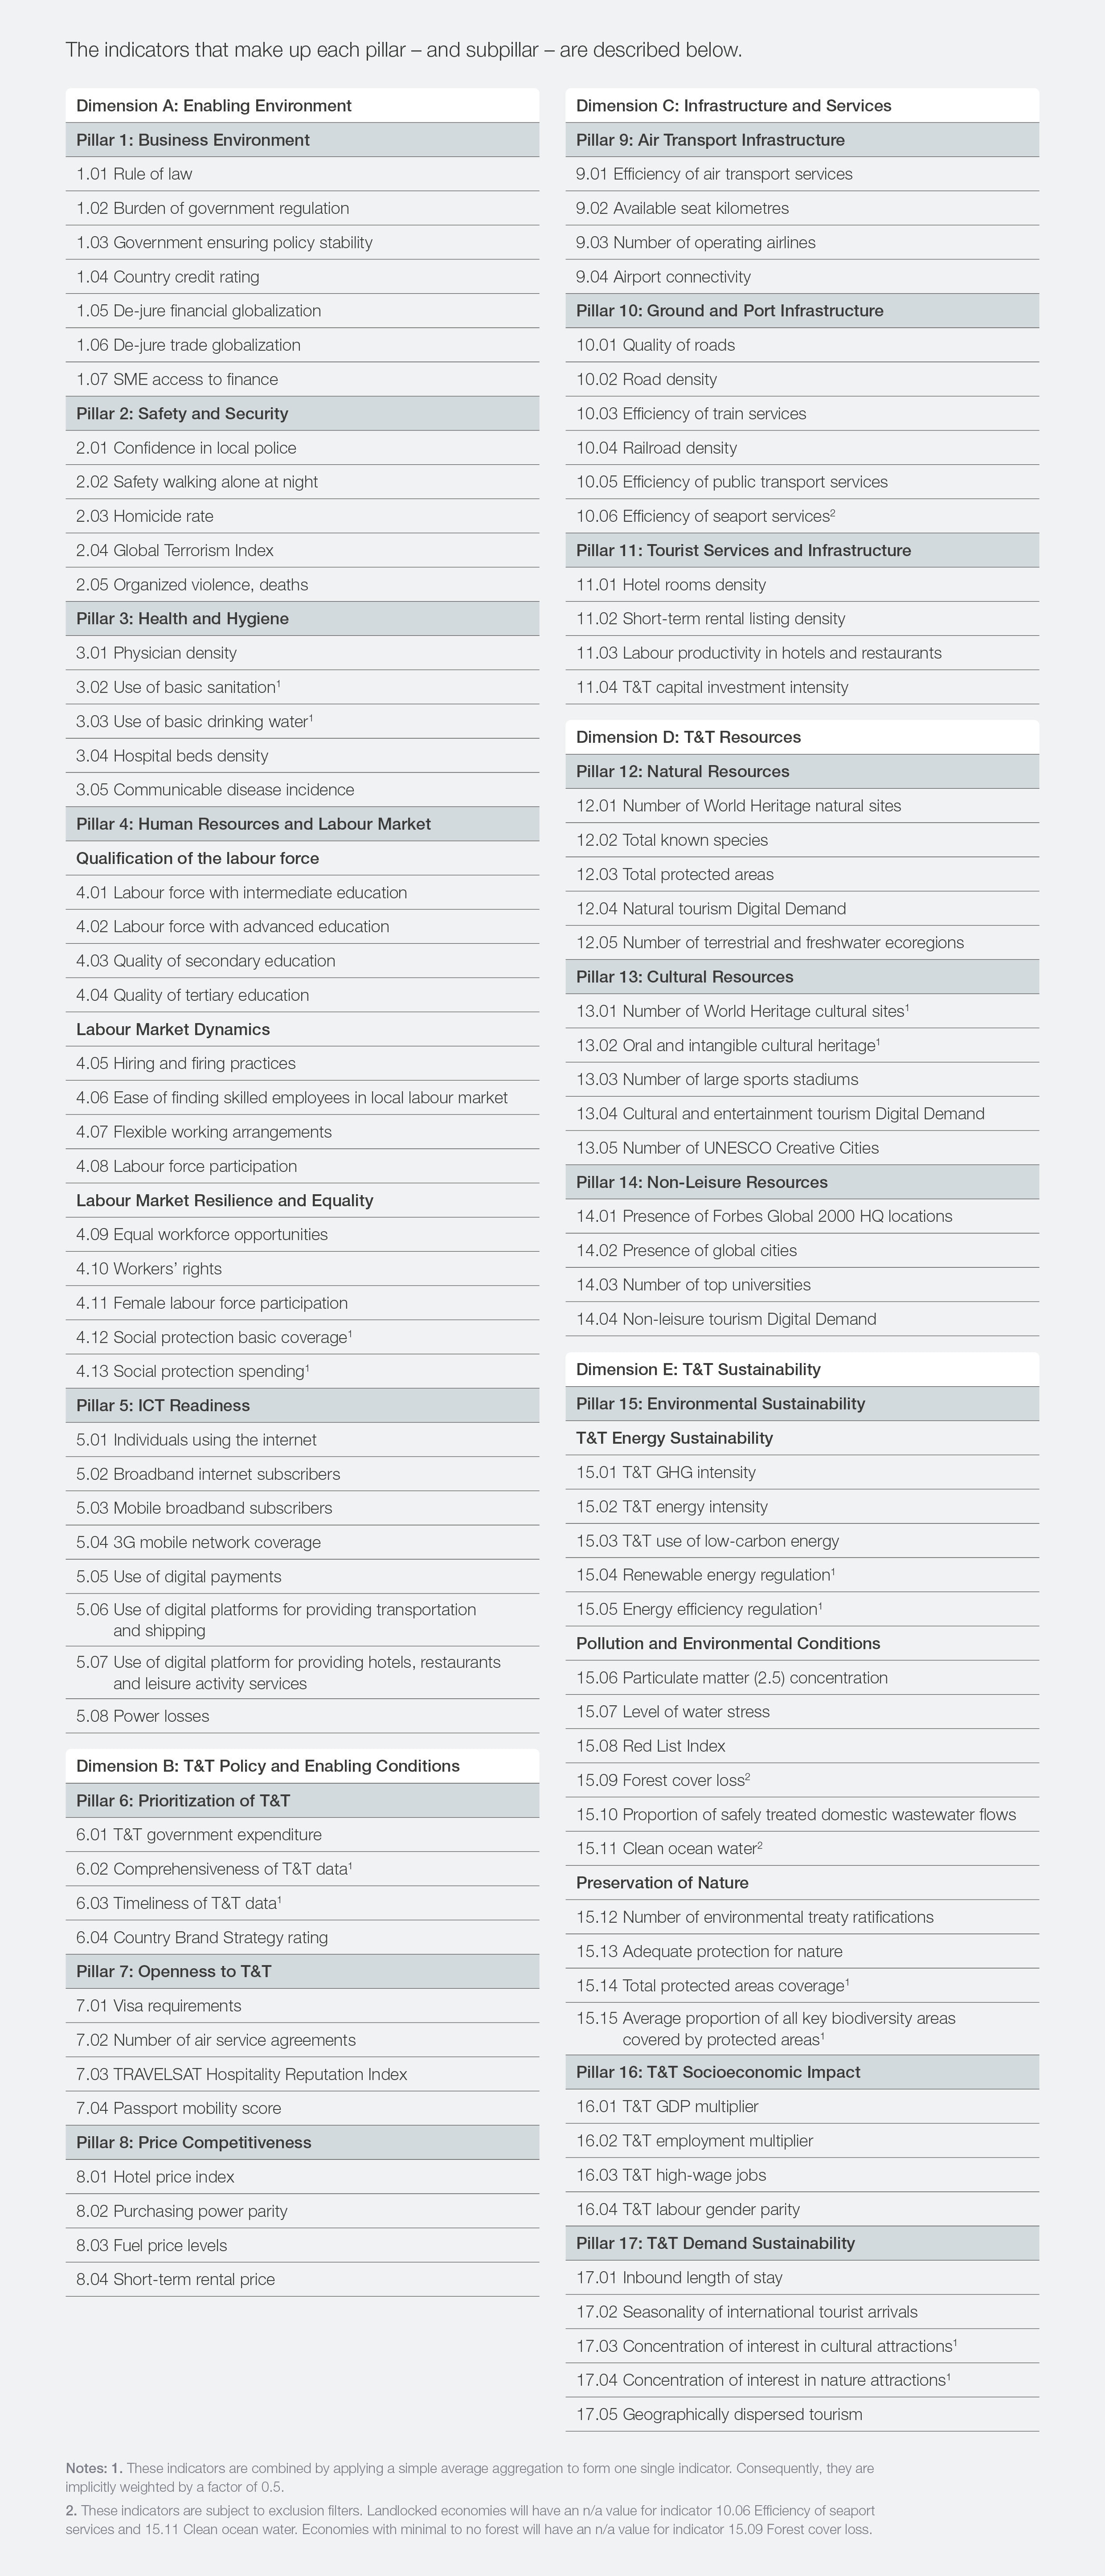

Table A2: Table of normalization
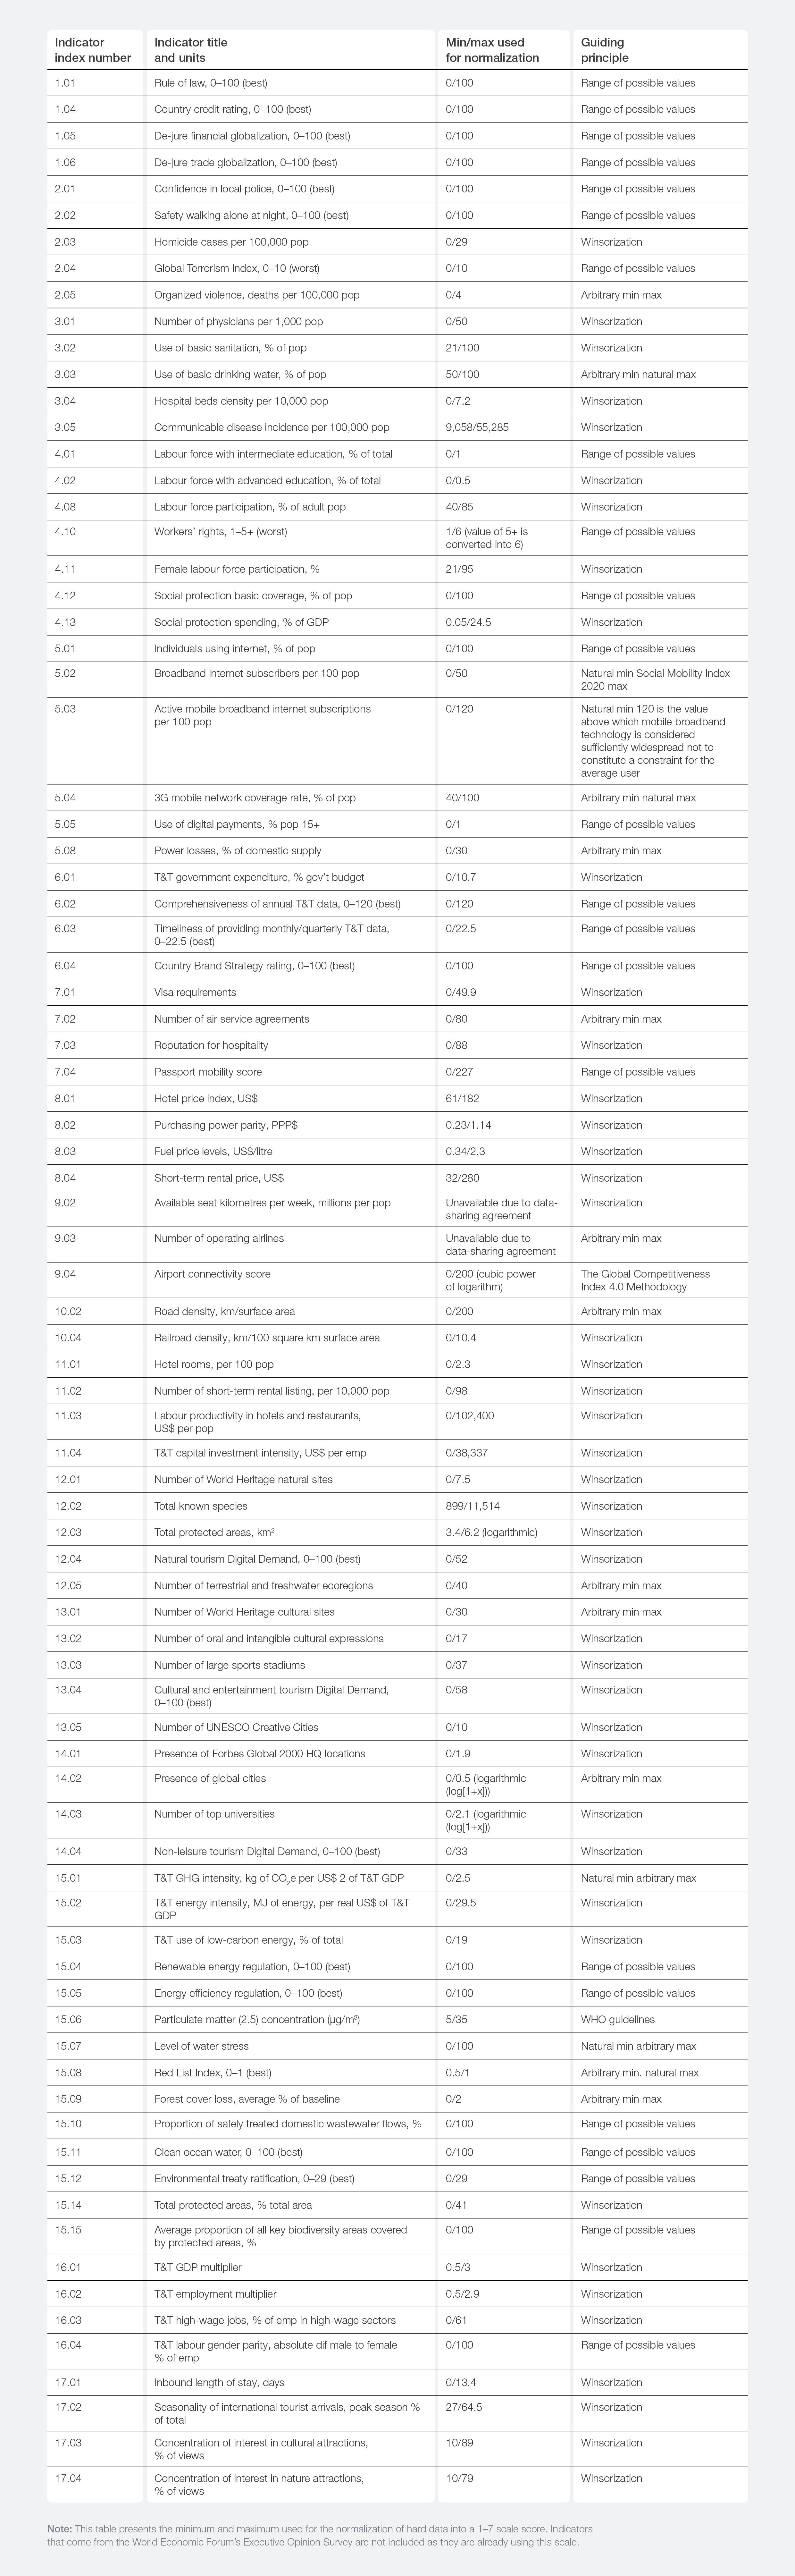

Table A3: Table of imputation

Index changes and comparability
Each new TTDI edition regularly includes: economy coverage changes; underlying indicator data revisions and methodology changes by sources; methodology adjustment such as normalization threshold changes; the addition and removal of indicators; and framework improvements.
Please note that the underlying data revisions and methodology changes make this edition of the index incompatible with the previously released version. Therefore, this release of the index includes recalculated 2019, 2021 and 2024 figures based on adjustments to ensure comparability. Consequently, TTDI results from 2019, 2021, 2024 and 2026 provided in this report are based on the latest TTDI methodology.
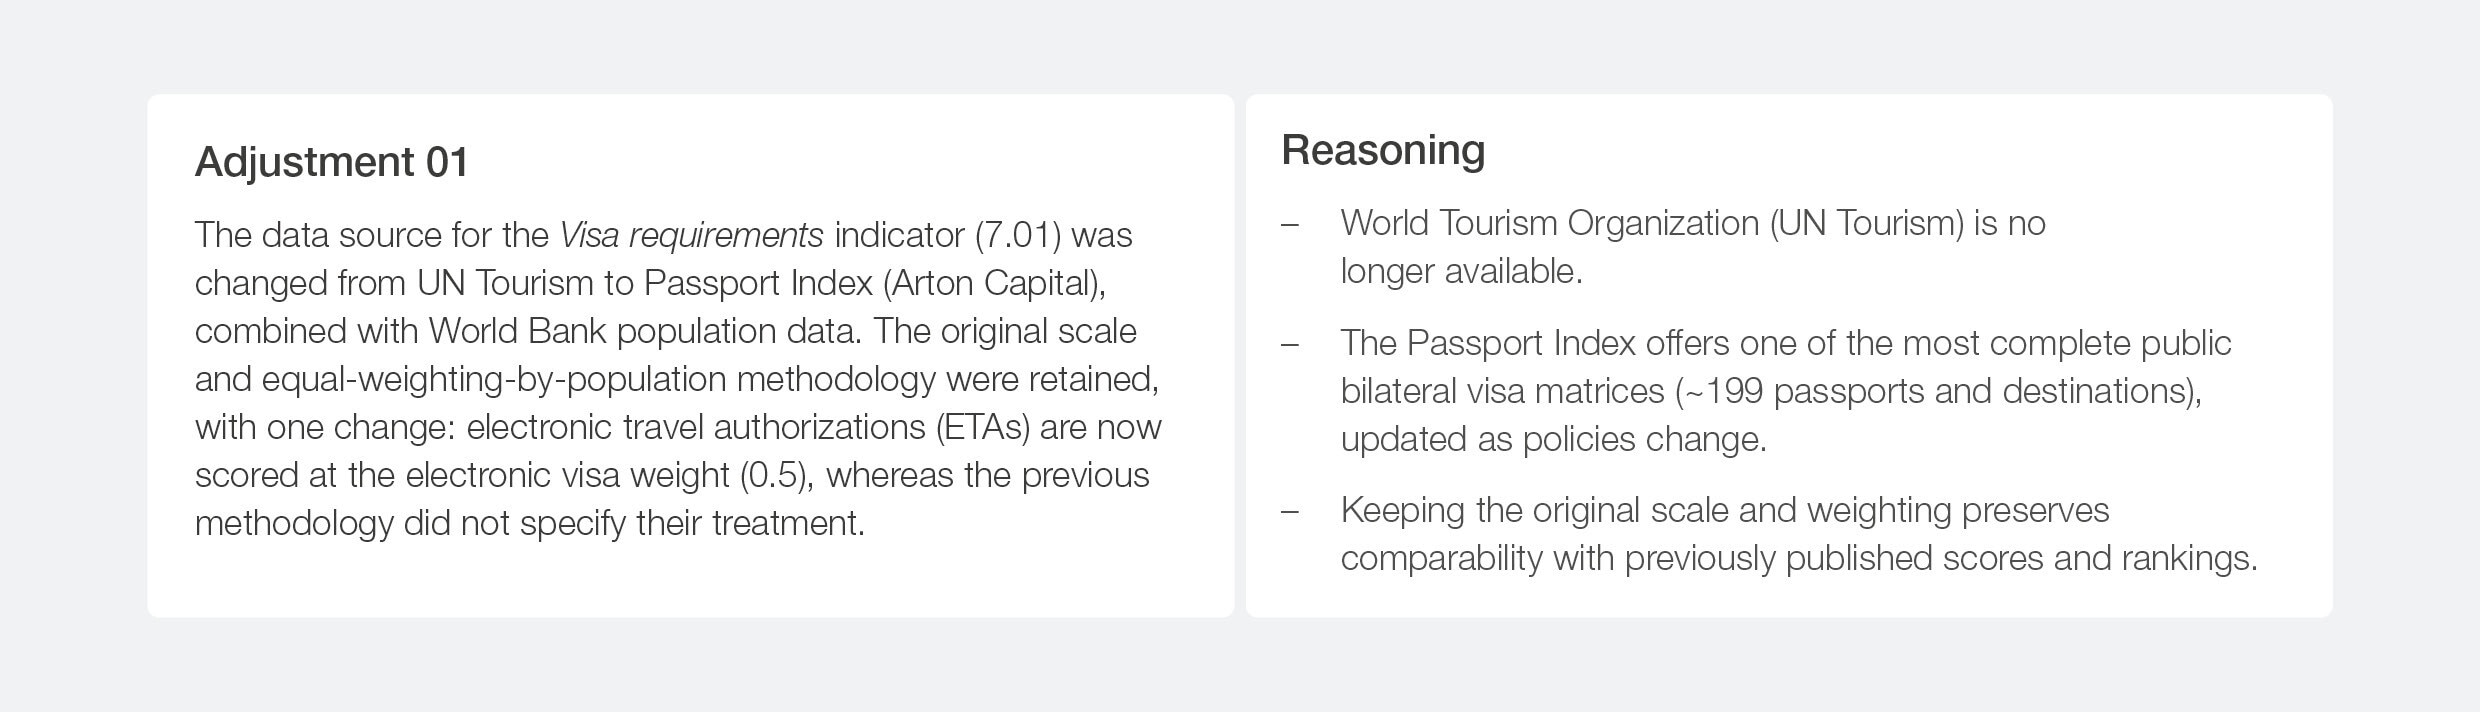
Most 2026 edition changes are due to underlying data revisions and threshold changes, with no changes being made to the framework. Table A3 provides a summary of the only indicator to have a methodology change introduced by the Forum.
Table A4: Details of adjustments made to the TTDI

Appendix B: Data definitions and sources
This section complements the data tables by providing full descriptions and sources of all the indicators used for the calculations in the Travel & Tourism Development Index (TTDI) 2026.
The data used in this publication includes data derived from the World Economic Forum’s Executive Opinion Survey as well as statistical data from other organizations. In the case of indicators derived from the Executive Opinion Survey (the survey), the full question and associated answers are provided. For more details on survey indicators, please email partner.institutes@weforum.org. Moreover, you can find information on Partner Institutes that carried out the survey in Appendix D.
For indicators sourced from other organizations or national sources, because of space limitations it is not possible to reproduce in this publication all of the additional information associated with specific data points. The data used in the computation of the TTDI 2026 represents the most recent and/ or best data available at the time when it was collected. It is possible that data has subsequently been updated or revised.
Pillar 1: Business Environment
1.01 Rule of law
Score for index assessing rule of law conditions based on property rights, judicial effectiveness and government integrity | 2026
The rule of law dimension of the Index of Economic Freedom is a mean of the property rights, judicial effectiveness and government integrity components. The property rights component is derived by averaging scores for equally weighted subfactors: risk of expropriation, respect for intellectual property rights, and quality of contract enforcement, property rights and law enforcement. The score for the judicial effectiveness component is derived by averaging scores for equally weighted subfactors: judicial independence; quality of the judicial process; and perceptions of the quality of public services and the independence of the civil service. The score for the government integrity component is derived by averaging scores for equally weighted subfactors: perception of corruption, bribery risk, and control of corruption, including “capture” of the state by elites and private interests. For information on the methodology of the Index of Economic Freedom, please visit: https://economicfreedom.heritage.org/pages/ about#indexMethodology.
Source: The Heritage Foundation, 2026 Index of Economic Freedom
1.02 Burden of government regulation
Response to the survey question: “In your country, how easy is it for companies to comply with government regulation and administrative requirements (e.g. permits, reporting, legislation)?” [1 = Overly complex; 7 = Extremely easy] | 2024– 2025 weighted average
Source: World Economic Forum, Executive Opinion Survey
1.03 Government ensuring political stability
Response to the survey question: “In your country, to what extent does the government ensure a stable policy environment for doing business?” [1 = Not at all; 7 = To a great extent] | 2024–2025 weighted average
Source: World Economic Forum, Executive Opinion Survey
1.04 Country credit rating
Average of scores across the rating of the three top rating agencies (S&P, Moody’s and DBRS) | 2026 Scoring the creditworthiness of a country between 100 (riskless) and 0 (likely to default), assigned according to Trading Economics’ methodology and based on Standard and Poor (S&P), Moody’s and DBRS sovereign debt credit rating. For information on the methodology, please visit: https://tradingeconomics.com/country-list/rating.
Source: Trading Economics
1.05 De-jure financial globalization
Composite index that measures “de-jure” financial globalization by considering investment restriction, capital accounts openness and international investment agreements | 2023
The index is part of the KOF Globalisation Index and consists of: 1) investment restriction as measured by the prevalence of foreign ownership and regulations to international capital flow; 2) capital account openness as measured by the Chinn–Ito Index of capital account openness; and 3) international investment agreements as measured by the number of bilateral investment agreements (BITs) and treaties with investment provisions. For information on the methodology, please visit: https://kof.ethz.ch/en/forecasts-and-indicators/ indicators/kof-globalisation-index.html.
Source: KOF Swiss Economic Institute, KOF Globalisation Index 2025
1.06 De-jure trade globalization
Composite index that measures “de-jure” trade globalization by considering trade regulations, trade taxes, tariffs and trade agreements | 2023
The index is part of the KOF Globalisation Index and consists of: 1) trade regulations as measured by the average of two subcomponents: prevalence of nontariff trade barriers and compliance costs of importing and exporting; 2) trade taxes as measured by income from taxes on international trade as percentage of revenue (inverted); 3) tariffs as measured by the unweighted mean of tariff rates; and 4) trade agreements as measured by the number of bilateral and multilateral free trade agreements. For information on the methodology, please visit: https://kof.ethz.ch/en/forecasts-andindicators/indicators/kof-globalisation-index.html.
Source: KOF Swiss Economic Institute, KOF Globalisation Index 2025
1.07 SME access to finance
Response to the survey question: “In your country, to what extent can small and medium-sized enterprises (SMEs) access the finance they need for their business operations through the financial sector?” [1 = Not at all; 7 = To a great extent] | 2024–2025 weighted average
Source: World Economic Forum, Executive Opinion Survey
Pillar 2: Safety and Security
2.01 Confidence in local police
Legatum Prosperity Index score based on percentage of people who responded “Yes” to the Gallup question: “Do you have confidence in the local police force?” | 2023
Source: 2025 Legatum Prosperity Index
2.02 Safety walking alone at night
Legatum Prosperity Index score based on percentage of people who responded “Yes” to the Gallup question: Do you feel safe walking alone at night in the city or area where you live? | 2024
Source: 2025 Legatum Prosperity Index
2.03 Homicide rate
Number of homicide cases per 100,000 population | 2023
The United Nations Office on Drugs and Crime (UNODC) collects statistics on homicide occurrences worldwide, pooling information from national sources, including criminal justice and public health systems, supplemented by international datasets and partnerships with organizations such as Eurostat, the Organization of American States (OAS) and the World Health Organization (WHO).
Source: United Nations Office on Drugs and Crime (UNODC)
2.04 Global Terrorism Index
A composite measure of the impact of terrorism, on a scale of 0–10 | 2025
The Global Terrorism Index (GTI) scores each country on a scale of 0–10, where 0 represents no impact from terrorism and 10 represents the highest measurable impact of terrorism. The factors used are the total number of terrorist incidents in a given year, total number of fatalities caused by terrorists in a given year, total number of injuries caused by terrorists in a given year and the total number of hostages caused by terrorists in a given year. Each of the factors is weighted between 0 and 3, and a five-year weighted average is applied in a bid to reflect the latent psychological effect of terrorist acts over time. A five-year weighted average is applied. For more information, please visit: https://www.visionofhumanity.org/ maps/globalterrorism-index/#/.
Source: Institute for Economics & Peace, Global Terrorism Index 2026: Measuring the Impact of Terrorism
2.05 Organized violence, deaths
Number of organized violent incidents, deaths per 100,000 population | 2020–2024 moving average
A measure of deaths from state-based armed conflict, non-state conflict and one-sided violence. The categories are mutually exclusive and can be aggregated as “organized violence”. They also share the same intensity cut-off for inclusion – 25 fatalities in a calendar year. For more information, please see https://ucdp.uu.se/encyclopedia. The final figure is a World Economic Forum calculation of non-state deaths divided by total population.
Source: Uppsala Conflict Data Program; The World Bank, World Development Indicators
Pillar 3: Health and Hygiene
3.01 Physician density
Physician density per 10,000 population | 2024
This indicator measures the number of physicians in the country per 10,000 population. Physicians include generalists, specialist medical practitioners and medical doctors not further defined.
Source: World Health Organization, Global Health Observatory
3.02 Use of basic sanitation
People using at least basic sanitation services as a percentage of total population | 2024
The percentage of people using at least basic sanitation services – that is, improved sanitation facilities that are not shared with other households. This indicator encompasses both people using basic sanitation services and those using safely managed sanitation services. Improved sanitation facilities include flush/pour flush to piped sewer systems, septic tanks or pit latrines and ventilated improved pit latrines, composting toilets or pit latrines with slabs.
Source: WHO/UNICEF Joint Monitoring Programme
3.03 Use of basic drinking water
People using at least basic drinking water services as a percentage of total population | 2024
The percentage of people using at least basic water services. This indicator encompasses both people using basic water services and those using safely managed water services. Basic drinking water services are defined as drinking water from an improved source, provided collection time is not more than 30 minutes for a round trip. Improved water sources include piped water, boreholes or tubewells, protected dug wells, protected springs and packaged or delivered water.
Source: WHO/UNICEF Joint Monitoring Programme
3.04 Hospital beds density
Number of hospital beds per 10,000 population | 2023
Hospital beds include inpatient beds available in public, private, general and specialized hospitals and rehabilitation centres. In most cases, beds for both acute and chronic care are included.
Source: World Bank, World Development Indicators
3.05 Communicable disease incidence
Select communicable disease incidence rate per 100,000 population | 2023
The incidence rate represents the number of people with a condition within a given period – the affected population – in relation to the total population within which these cases have arisen (in the same period) – the target population. Communicable diseases covered by this indicator include HIV/AIDS and other sexually transmitted infections, lower respiratory infections and tuberculosis, neglected tropical diseases, malaria and other infectious diseases. Enteric infections, COVID-19 and upper respiratory infections are excluded.
Source: Institute for Health Metrics and Evaluation, Global Burden of Disease (GBD) Results Tool, 2024
Pillar 4: Human Resources and Labour Market
Qualification of the Labour Force subpillar
4.01 Labour force with at least intermediate education
Share of labour force that has at least an intermediate education | 2025
Intermediate education comprises upper secondary or post-secondary non-tertiary education according to the International Standard Classification of Education 2011 (ISCED 2011).
Source: International Labour Organization
4.02 Labour force with advanced education
Share of labour force that has an advanced education | 2025
Advanced education comprises short-cycle tertiary education, a bachelor’s degree or equivalent education level, a master’s degree or equivalent education level, or doctoral degree or equivalent education level according to the International Standard Classification of Education 2011 (ISCED 2011).
Source: International Labour Organization
4.03 Quality of secondary education
Response to the survey question: “In your country, how well does secondary non-vocational education meet the needs of a competitive economy?” [1 = Not at all; 7 = To a great extent] | 2024–2025 weighted average
Source: World Economic Forum, Executive Opinion Survey
4.04 Quality of tertiary education
Response to the survey question: “In your country, how well does tertiary education meet the needs of a competitive economy?” [1 = Not at all; 7 = To a great extent] | 2024–2025 weighted average
Source: World Economic Forum, Executive Opinion Survey
Labour Market Dynamics subpillar
4.05 Hiring and firing practices
Response to the survey question: “In your country, to what extent do regulations allow flexible hiring and firing of workers?” [1 = Not at all; 7 = To a great extent] | 2024–2025 weighted average
Source: World Economic Forum, Executive Opinion Survey
4.06 Ease of finding skilled employees in local labour market
Response to the survey question: “In your country, to what extent can companies find people with the skills required to fill their vacancies in the local labour market?” [1 = Not at all; 7 = To a great extent] | 2024–2025 weighted average
Source: World Economic Forum, Executive Opinion Survey
4.07 Flexible working arrangements
Response to the survey question: “In your country, to what extent do companies offer flexible working arrangements such as remote, hybrid and parttime work?” [1 = Not at all; 7 = To a great extent] | 2024–2025 weighted average
Source: World Economic Forum, Executive Opinion Survey
4.08 Labour force participation
Proportion of the population aged 15 and older that is economically active | 2025
Labour force participation rate is the proportion of the population aged 15 and older that is economically active: that is, all people who supply labour for the production of goods and services during a specified period.
Source: World Bank, World Development Indicators
Labour Market Resilience and Equality subpillar
4.09 Equal workforce opportunities
Average score across the four components of the following Executive Opinion Survey question: “In your country, to what extent do companies give equal workforce opportunities to: a. Women; b. All ethnic or racial backgrounds; c. Those with disabilities; d. Those who identify as LGBTQI+?” [1 = Not at all; 7 = To a great extent] | 2024–2025 weighted average
Source: World Economic Forum, Executive Opinion Survey
4.10 Workers’ rights
The ITUC Global Rights Index measures countries on a scale from 1–5+ based on the degree of respect for workers’ rights, with 1 being the best rating and 5+ the worst rating | 2025
Each country is analysed against a list of 97 indicators derived from ILO conventions and jurisprudence and represents violations of workers’ rights in law and practice. Values correspond to the following conditions: 5+ means no guarantee of rights due to the breakdown of the rule of law, 5 means no guarantee of rights, 4 means systematic violations of rights, 3 means regular violations of rights, 2 means repeated violations of rights and 1 means sporadic violations of rights. For more information on the methodology, please visit: https://www.ituc-csi.org/the-global-rights-indexexplained.
Source: International Trade Union Confederation, 2026 ITUC Global Rights Index
4.11 Female labour force participation
Ratio of female to male labour force participation rate | 2025
Labour force participation rate is the proportion of the population aged 15 and older that is economically active: it covers all people who supply labour for the production of goods and services during a specified period. The ratio of female to male labour force participation rate is calculated by dividing the female labour force participation rate by the male labour force participation rate and multiplying by 100.
Source: World Bank, World Development Indicators
4.12 Social protection basic coverage
Proportion of population covered by at least one social protection benefit | 2025
This indicator conveys the share of the population effectively covered by a social protection system, including social protection floors. It also provides the coverage rates of the main functions of social protection: child and maternity benefits, support for people without a job, people with disabilities, workers in case of work injury, older persons, and poor and vulnerable people. For more information, please visit: https://ilostat.ilo.org/methods/concepts-and-definitions/description-sustainabledevelopment-labour-market-indicators/.
Source: International Labour Organization, International Labour Organization Database on International Labour Statistics (ILOSTAT) database
4.13 Social protection spending
Government expenditure on social security and welfare as a percentage of GDP | 2025
This indicator refers to all non-repayable payments by general government, whether capital or current, requited or not. General government expenditure on social security and welfare includes: sickness and disability, old age, survivors, family and children, unemployment, housing, social exclusion, R&D on social protection, social protection n.e.c.
Source: Euromonitor International
Pillar 5: ICT Readiness
5.01 Individuals using internet
Percentage of individuals using the internet | 2025
Internet users refers to people using the internet from any device (including mobile phones) in the past three months. Data is based on surveys generally carried out by national statistical offices or estimated based on the number of internet subscriptions.
Source: International Telecommunication Union, World Telecommunication Indicators
5.02 Broadband internet subscribers
Fixed broadband internet subscriptions per 100 population | 2024
This refers to total fixed (wired) broadband internet subscriptions (that is, subscriptions to highspeed access to the public internet – a TCP/IP connection – at downstream speeds equal to or greater than 256 kb/s).
Source: International Telecommunication Union, World Telecommunication Indicators
5.03 Mobile broadband subscribers
Mobile broadband subscriptions per 100 population | 2024
Active mobile-broadband subscriptions per 100 inhabitants.
Source: International Telecommunication Union, World Telecommunication Indicators
5.04 3G mobile network coverage
Percentage of total population covered by at least a 3G mobile network signal | 2024
Percentage of the population covered by at least a 3G mobile network refers to the percentage of inhabitants who are within range of at least a 3G mobile-cellular signal, irrespective of whether or not they are subscribers. This is calculated by dividing the number of inhabitants that are covered by at least a 3G mobile-cellular signal by the total population and multiplying by 100.
Source: International Telecommunication Union, World Telecommunication Indicators
5.05 Use of digital payments
Share of population 15 or older who made or received a digital payment | 2024
Digital payment includes the use of mobile money, a debit or credit card, or a mobile phone to make a payment from an account, or the use of the internet to pay bills or to buy something online or in a store, or to pay bills or send or receive remittances directly from or into a financial institution account or through a mobile money account in the past year. It also includes receiving payments for agricultural products, government transfers, wages or a publicsector pension into a financial institution account or through a mobile money account in the past year.
Source: The World Bank, Findex
5.06 Use of digital platforms for providing transportation and shipping
Response to the survey question: “In your country, to what extent are digital platforms* used to provide the following service: Transportation and shipping?” [1 = Not at all; 7 = To a great extent] *Digital platforms refer to services and labour markets available through a digital interface, often focused on short-term contracts and task-based work. | 2024–2025 weighted average
Source: World Economic Forum, Executive Opinion Survey
5.07 Use of digital platform for providing hotels, restaurants and leisure activities services
Response to the survey question: “In your country, to what extent are digital platforms* used to provide the following service: Hotels, restaurants and leisure activities services?” [1 = Not at all; 7 = To a great extent] *Digital platforms refer to services and labour markets available through a digital interface, often focused on short-term contracts and task-based work. | 2024–2025 weighted average
Source: World Economic Forum, Executive Opinion Survey
5.08 Power losses
Electric power transmission and distribution losses as a percentage of domestic supply | 2023
“Electric power transmission and distribution losses” are losses in transmission between sources of supply and points of distribution and in the distribution to consumers, including pilferage.
Source: International Energy Agency, Energy Data Center
Pillar 6: Prioritization of T&T
6.01 T&T government expenditure
Travel and tourism government spending as a percentage of total government consumption | 2025
This indicator includes spending (transfers or subsidies) made by government agencies to provide T&T services such as cultural (e.g. art museums), recreational (e.g. national parks), clearance (e.g. immigration/customs) and so on to visitors.
Source: World Travel & Tourism Council, Travel & Tourism Economic Impact Research 2026: https://researchhub.wttc.org/
6.02 Comprehensiveness of T&T data
Number of data available (0 = no data, 120 = all selected indicators are available) | 2018–2021
This indicator shows how much of the yearly data provided by national administrations on 30 different concepts from the UNWTO Compendium of Tourism Statistics is available. It covers 2018 through to 2021. The scores range from a minimum of 0 to a maximum of 120, where 120 can be obtained by a country providing data for all 30 concepts in all of the four years taken into consideration.
Source: United Nations World Tourism Organization (UN Tourism)
6.03 Timeliness of T&T data
Number of latest data available (0 = no data, 22.5 = data reported for all the periods considered) | 2024–2025
This indicator shows the availability of two key T&T indicators (international tourist arrivals and tourism receipts) on a monthly or quarterly basis, covering the period from October 2024 to December 2025. UN Tourism has calculated the score for each country based on the data included in the latest available UN Tourism World Tourism Barometer by adding the number of months for which data on international tourist arrivals is available to the number of months for which data on international tourism receipts is available. Half weight has been applied to the lower of the two scores, so the scores range from a minimum of 0 to a maximum of 22.5 (the maximum number of period counts a country can get is 14 for one measure and 7 for the other).
Source: United Nations World Tourism Organization (UN Tourism)
6.04 Country Brand Strategy rating © (CBS)
This indicator evaluates the accuracy of a National Tourism Organization (NTO)’s Country Brand Strategy | 2024-2025 moving average
The Country Brand Strategy © (CBS) rating measures how closely an NTO’s official tourism website aligns with current traveller search demand. It compares the tourism-related brandtags most frequently searched for in a country with those most heavily promoted on its official tourism website. A higher rating shows stronger alignment between the website’s content and the brandtags with the highest demand. A lower rating may indicate limited focus on high-demand brandtags or greater promotion of less popular ones. Data on the brandtags most promoted on an NTO’s official tourism website is collected at a specific point during the year. Results may vary over time due to changes in website content or structure, traveller search patterns and the tools used to interpret evolving search behaviour, including AIdriven discovery.
Note: Exceptions may apply when a country introduces a new Country Brand Strategy to promote lesser-known brandtags and develop new markets. A lower rating may mean that the impact of the strategy is not yet reflected in traveller search demand. Exceptions may also apply when an NTO’s website is being updated to adapt to new search and AI trends. In this case, the rating may not yet reflect the impact of those updates.
Source: Bloom Consulting and D2 Digital Demand © data, based on search demand from market-leading search engines worldwide (mobile and desktop)
Pillar 7: Openness to T&T
7.01 Visa requirements
Visa requirements for entry in the destination country for a tourism visit of a limited duration from worldwide source markets | 2025
This indicator measures to what extent a destination country is facilitating inbound tourism through its visa policy, distinguishing whether the country can be visited without a visa, a visa can be obtained on arrival or an electronic visa (including electronic travel authorizations) is available. It is calculated as a percentage of the world population that is exempt from a visa or is eligible for a visa on arrival or an electronic visa when visiting the destination country, where each source market is weighted equally by its share of world population, and: 1) the population of source markets that can visit the destination country without a visa is fully counted (i.e. weight 1); 2) the population of source markets that can obtain a visa on arrival when entering the destination country is weighted by 0.7; and 3) the population of source markets that can use an electronic visa – including electronic travel authorizations (e.g. ESTA, eTA, NZeTA), which the source groups together with electronic visas – is weighted by 0.5. Source markets for which entry is not admitted are scored 0.
Source: Arton Capital, Passport Index (passportindex.org); The World Bank, World Development Indicators
7.02 Number of air service agreements
Number of air service agreements weighted by level of liberalization | 2023
This indicator measures the number of air service agreements (ASAs) to which an economy is party, weighted by level of liberalization. Traditional agreements receive a weight of 0.5, transitional agreements receive 0.75 and fully liberalized agreements receive 1.0. Please note that all European Union member states are treated as if they have a fully liberalized agreement with fellow members, with bilateral agreements between European Union member states not counted. The same methodology goes for economies covered by the European Common Aviation Area, the Euro–Mediterranean Aviation Agreement, the EU–US Open Skies Agreement, the EU–Canada Comprehensive Air Transport Agreement and the ASEAN Open Sky Agreement. Data and classification come from ICAO’s WASA database, which can be accessed at: https://www.icao.int/sustainability/Pages/WASA.aspx.
Source: International Civil Aviation Organization (ICAO), WASA Database
7.03 Reputation for hospitality
TRAVELSAT Hospitality Reputation Index | March 2025 to March 2026
The TRAVELSAT Reputation Index for locals’ hospitality quantifies the sentiment polarity in online discussions about the friendliness and hospitality of local residents towards visitors, across various platforms such as media, blogs and social networks. It generates a score reflecting the overall positivity or negativity in these conversations, influenced by a wide range of factors including sustainability, economic, environmental and sociopolitical issues that can affect the perceived hospitality of a destination’s community.
Source: TRAVELSAT, MMGY TCI Research
7.04 Passport mobility score
Score for visa-free access for a country’s passport to travel destinations as measured by the Henley Passport Index | 2026
For each travel destination, if no visa is required for passport holders from a country or territory, then a score with value = 1 is created for that passport. A score with value = 1 is also applied if passport holders can obtain a visa on arrival, a visitor’s permit or an electronic travel authorization (ETA) when entering the destination. These types of visa require no pre-departure government approval because of the specific visa-waiver programmes in place. Where a visa is required, or where a passport holder has to obtain a government-approved electronic visa (eVisa) before departure, a score with value = 0 is assigned. A score with value = 0 is also assigned if passport holders need pre-departure government approval for a visa on arrival, a scenario that is not considered “visa-free”. The total score for each passport is equal to the number of destinations for which no visa is required (value = 1), under the conditions defined above.
Source: Henley & Partners Holdings
Pillar 8: Price Competitiveness
8.01 Hotel price index
Average room rates calculated for midscale to upper-upscale hotels (US$) | 12-month average through to July 2025
This index measures the average price, in US dollars, of midscale to upper-upscale hotel accommodation in each country. The index is calculated by using the average room rate achieved by midscale to upper-upscale hotels in each country over a 12-month period from July 2024 through July 2025, to mitigate the impact of any seasonality fluctuations.
Source: CoStar
8.02 Purchasing power parity
Ratio of purchasing power parity (PPP) conversion factor to the official exchange rate | 2024
The World Bank defines the purchasing power parity (PPP) conversion factor as the number of units of a country’s currency required to buy the same amount of goods and services in the domestic market as a US dollar would buy in the United States. Official exchange rate refers to the exchange rate determined by national authorities or to the rate determined in the legally sanctioned exchange market. It is calculated as an annual average based on monthly averages (local currency units relative to the US dollar). The variable shown is the PPP conversion factor to market exchange rate ratio as reported by the World Bank’s World Development Indicator database.
Source: The World Bank, World Development Indicators
8.03 Fuel price levels
Retail gasoline (petrol) prices expressed as US dollars per litre | 2026
This indicator refers to the annual average of pump prices of octane-95 gasoline (petrol).
Source: Globalpertrolprices.com
8.04 Short-term rental price
Average daily rate for active properties on Airbnb and similar platforms | 12-month average 2025
Source: AirDNA
Pillar 9: Air Transport Infrastructure
9.01 Efficiency of air transport services
Response to the survey question: “In your country, how efficient (in terms of frequency, punctuality, speed and price) are the following transport services: Air transport services?” [1 = Extremely inefficient – among the worst in the world; 7 = Extremely efficient – among the best in the world] | 2024–2025 weighted average
Source: World Economic Forum, Executive Opinion Survey
9.02 Available seat kilometres
Domestic and international seat kilometres originating in country per week (year average) per population | 2024
This indicator measures an airline’s passengercarrying capacity. It is composed of the number of seats available on each flight multiplied by the flight distance in kilometres. The final value represents the weekly average for the year (Jan–Dec), taking into account flights scheduled beforehand by airline companies divided by country population.
Source: International Air Transport Association (IATA), OAG data; World Bank, World Development Indicators
9.03 Number of operating airlines
Number of airlines with scheduled passenger flights originating in the country | 2025
Source: International Air Transport Association (IATA), OAG data
9.04 Airport connectivity
This represents the IATA airport connectivity indicator, which measures the degree of integration of a country within the global air transport network | 2025
Source: International Air Transport Association (IATA), OAG data
Pillar 10: Ground and Port Infrastructure
10.01 Quality of roads
Response to the survey question: “In your country, what is the quality and extent of road infrastructure?” [1 = Extremely poor – among the worst in the world; 7 = Extremely good – among the best in the world] | 2024–2025 weighted average
Source: World Economic Forum, Executive Opinion Survey
10.02 Road density
Kilometres of road per 100 square kilometres of land | 2025
Road density is the ratio of the length of the country’s total road network to the country’s land area. The road network includes all motorways, highways and main or national roads, secondary or regional roads, and all other roads.
Source: Euromonitor International
10.03 Efficiency of train services
Response to the survey question: “In your country, how efficient (in terms of frequency, punctuality, speed, price) are train services (if applicable)?” [1 = Extremely inefficient – among the worst in the world; 7 = Extremely efficient – among the best in the world] | 2024–2025 weighted average
Source: World Economic Forum, Executive Opinion Survey
10.04 Railroad density
Kilometres of railroad per 100 square kilometres of land | 2025
Railroad density is the ratio of the length of the country’s total railroad network to the country’s land area. Rail lines are the length of railway route available for train service, irrespective of the number of parallel tracks.
Source: Euromonitor International
10.05 Efficiency of public transport services
Response to the survey question: “In your country, how efficient (in terms of frequency, punctuality, speed, price) are the following transport services: Public transport services (e.g. buses, trains, subways, electric bikes and taxis)?” [1 = Extremely inefficient – among the worst in the world; 7 = Extremely efficient – among the best in the world] | 2024–2025 weighted average
Source: World Economic Forum, Executive Opinion Survey
10.06 Efficiency of seaport services
Response to the survey question: “In your country, how efficient (in terms of frequency, punctuality, speed, price) are the following transport services: Seaport services (ferries, boats)?” [1 = Extremely inefficient – among the worst in the world; 7 = Extremely efficient – among the best in the world] | 2024–2025 weighted average
Source: World Economic Forum, Executive Opinion Survey
Pillar 11: Tourist Services and Infrastructure
11.01 Hotel rooms density
Number of hotel rooms per 100 population | 2024
Source: United Nations World Tourism Organization (UN Tourism); The World Bank, World Development Indicators
11.02 Short-term rental listing density
Number of active properties on Airbnb and similar platforms per 10,000 people | 12-month average ending in June 2025
Source: AirDNA; The World Bank, World Development Indicators
11.03 Labour productivity in hotels and restaurants
Sector output (gross value added) divided by employed population in constant 2020 PPP $ | 2023, 2024, 2025 moving average
This indicator category corresponds to division H of the International Standard Classification of all Economic Activities (ISIC Rev 3.1) and includes: hotels and restaurants.
Source: Euromonitor International
11.04 T&T capital investment intensity
Travel and tourism capital investment per sector employee | 2024, 2025 average
This indicator includes government-sector investment expenditure (e.g. equipment, land, buildings, infrastructure) and private-sector investment expenditures (e.g. hotels, convention centres, airports, taxis).
Source: World Travel & Tourism Council, Travel & Tourism Economic Impact Research 2026: https://researchhub.wttc.org/
Pillar 12: Natural Resources
12.01 Number of World Heritage natural sites
Number of World Heritage natural sites in the country | 2025
World Heritage natural sites are those properties that the World Heritage Committee considers to have outstanding universal value.
Source: UNESCO World Heritage Centre
12.02 Total known species
Number of animal, plant, fungus and chromista species in the country | 2025
This indicator measures the total number of species assessed and included on the IUCN Red List of Threatened Species, covering animals, plants, fungi and other taxonomic groups.
Source: International Union for Conservation of Nature and Natural Resources (IUCN), Red List
12.03 Total protected areas
Total square kilometres of terrestrial and marine areas under protection | 2026
Based on the IUCN’s definition, a protected area is a clearly defined geographical space, recognized, dedicated and managed, through legal or other effective means, to achieve the long-term conservation of nature with associated ecosystem services and cultural values. Protected areas include nature reserves, wilderness areas, national parks, natural monuments, habitat/species management, protected landscape/seascape and managed resource protected area. The data undergoes a logarithmic transformation before being scaled from 1 to 7. For more information on protected areas and the associated methodology, please see: https://www.protectedplanet.net/en/ thematic-areas/wdpa?tab=Methodology.
Source: United Nations Environment Programme– World Conservation Monitoring Centre (UNEP–WCMC), World Database of Protected Areas
12.04 Natural tourism Digital Demand
This indicator measures the total online search volume related to the following nature-related brandtags: Beach Accommodation, Beaches, Gardens, Natural Wonders, Parks and Reserves, Camping, Golf Accommodation, Rural Accommodation, Ski Accommodation, Diving, Golf, Water Sports, Winter Sports, Adventure and Outdoor, Animal Watching, Boating, Fishing, Hunting and Hiking | 2023, 2024, 2025 moving average
The calculation is based on the proprietary D2 Digital Demand © tool, which assesses the attractiveness of each country by analysing online tourism-related search data across the relevant brandtags, each comprising destination-specific keywords correlated to tourist activities and attractions. A total of 15,721,000 keywords were analysed across 199 countries and territories, in 21 languages: Arabic, Chinese (Mandarin), Danish, Dutch, English, Estonian, Finnish, French, German, Italian, Japanese, Korean, Lithuanian, Norwegian, Polish, Portuguese, Russian, Spanish, Swedish, Turkish and Vietnamese.
Source: Bloom Consulting and D2 Digital Demand © data, market leader search engines across the world (mobile and desktop)
12.05 Number of terrestrial and freshwater ecoregions
Number of terrestrial and freshwater ecoregions | 2021
The World Wide Fund for Nature (WWF) defines an ecoregion as a “large unit of land or water containing a geographically distinct assemblage of species, natural communities, and environmental conditions”. This includes terrestrial, marine and freshwater ecoregions.
Source: One Earth; Freshwater Ecoregions of the World (FEOW)
Pillar 13: Cultural Resources
13.01 Number of World Heritage cultural sites
Number of World Heritage cultural sites in the country | 2025
World Heritage cultural sites are those properties that the World Heritage Committee considers as having outstanding universal value.
Source: UNESCO World Heritage Centre
13.02 Oral and intangible cultural heritage
Number of oral and intangible heritage practices and expressions | 2025
Intangible cultural heritage practices are those practices, representations, expressions, knowledge and skills – as well as the instruments, objects, artefacts and cultural spaces associated therewith – that communities, groups and, in some cases, individuals recognize as part of their cultural heritage. This intangible cultural heritage, transmitted from generation to generation, is constantly recreated by communities and groups in response to their environment and their interaction with nature and their history, and provides them with a sense of identity and continuity, thus promoting respect for cultural diversity and human creativity. The Intergovernmental Committee for the Safeguarding of the Intangible Cultural Heritage evaluates nominations proposed by States Parties to the Convention for the Safeguarding of the Intangible Cultural Heritage annually and decides whether or not to inscribe those cultural practices and expressions of intangible heritage on the Convention’s Lists.
Source: UNESCO Intangible Cultural Heritage
13.03 Number of large sports stadiums
Total number of sports stadiums in a country with a capacity greater than 20,000 seats | 2025
The count of stadiums with a capacity greater than 20,000 seats is a proxy for the ability of a country to host significant sports or entertainment events (e.g. concerts, shows).
Source: Worldofstadiums.com
13.04 Cultural and entertainment tourism Digital Demand
This indicator measures the total online search volume related to the following culture and entertainment-related brandtags: Gastro Activities, Restaurants, Local Gastronomy, Historical Sites, Museums, UNESCO, History, Local Dances, Local People and Tribes, Local Traditions, Traditional Markets, Religious Sites and Pilgrimage, Performing Arts, Urban Landmarks, Aquariums, Entertainment Parks, Gambling, Nightlife, Shopping, Special Events and Zoos | 2023, 2024, 2025 moving average The calculation is based on the proprietary D2 Digital Demand © tool, which assesses the attractiveness of each country by analysing online tourism-related search data across the relevant brandtags, each comprising destination-specific keywords correlated to tourist activities and attractions. A total of 18,308,000 keywords were analysed across 199 countries and territories, in 21 languages: Arabic, Chinese (Mandarin), Danish, Dutch, English, Estonian, Finnish, French, German, Italian, Japanese, Korean, Lithuanian, Norwegian, Polish, Portuguese, Russian, Spanish, Swedish, Turkish and Vietnamese.
Source: Bloom Consulting and D2 Digital Demand ˝ data, market leader search engines across the world (mobile and desktop)
13.05 Number of UNESCO Creative Cities
Number of cities that are members of UNESCO’s Creative Cities Network | 2025
The UNESCO Creative Cities Network (UCCN) was created in 2004 to promote cooperation with and among cities that have identified creativity as a strategic factor for sustainable urban development. Cities that currently make up this network work together towards a common objective: placing creativity and cultural industries at the heart of their development plans at the local level and cooperating actively at the international level.
Source: UNESCO Creative Cities Network
Pillar 14: Non-Leisure Resources
14.01 Presence of Forbes Global 2000 HQ locations
Ratio of the share of Forbes Global 2000 companies based in an economy to the economy’s share of global GDP | 2023, 2024, 2025 moving average
Forbes Global 2000 is a list of the 2,000 largest public companies in the world based on sales, profits, assets and market value. A company needs to qualify for at least one of the category lists to be eligible for the final Global 2000 ranking. For more information on the Global 2000 methodology, please visit: https://www.forbes.com/sites/andreamurphy/2025/05/27/2025-global-2000-methodology/.
Source: Forbes, Global 2000; The World Bank, World Development Indicators
14.02 Presence of global cities
The indicators measure the presence of cities ranked by Globalization and World Cities Research Network (GaWC) | 2024
GaWC ranking results are derived from the activities of 175 leading firms providing advanced producer services (finance, management consultancy, accountancy, corporate law and advertising) across 785 cities worldwide. The results should be interpreted as indicating the importance of cities as nodes in the world city network (i.e. enabling corporate globalization). The connectivity measures are used to classify cities into levels of world city network integration. Alpha-level cities are linked to major economic states and regions and into the world economy and are classified into four sections, Alpha ++, Alpha +, Alpha and Alpha – cities. Beta-level cities are cities that link moderate economic regions to the world economy and are classified into three sections, Beta +, Beta and Beta – cities. Gammalevel cities are cities that link smaller economic regions into the world economy and are classified into three sections, Gamma +, Gamma and Gamma – cities. Sufficiency-level cities are cities that have a sufficient degree of services so as not to be overly dependent on world cities. For the purpose of calculating this indicator, each country’s score is the sum of points of all of the ranked cities based in the economy, with points determined by city classification. A logarithmic transformation is applied to final point values.
Source: Globalization and World Cities (GaWC) Research Network
14.03 Number of top universities
Number of top 10,000 universities as ranked by Webometrics Ranking of World Universities | 2025
This indicator is the weighted average of all universities based on ranking tier. A university’s rank is based on a composite index that looks at its web content impact, top-cited researchers and top-cited papers. Universities ranked 1–100 receive full weight, 101–500 receive 1/2 weight, 501–1,000 receive 1/4 weight, 1,001–5,000 receive 1/6 weight and 5,001– 10,000 receive 1/16 weight. Institutions ranked 10,001 and above are not counted. Data undergoes a log transformation before being normalized. For more information on the ranking, please see https://www.webometrics.org/.
Source: Cybermetrics Lab, Consejo Superior de Investigaciones Cient.ficas (CSIC)
14.04 Non-leisure tourism Digital Demand
This indicator measures the total online search volume related to business tourism, study and health tourism brandtags: Business, Entrepreneurship, Exchange Programmes and Financial Aid, Degrees and Courses, Voluntary and Medical Tourism | 2023, 2024, 2025 moving average
The calculation is based on the proprietary D2 Digital Demand © software, which assesses the attractiveness of each country by analysing online tourism-related search data across the relevant brandtags, each comprising destination-specific keywords correlated to tourist activities and attractions. A total of 3,721,000 keywords were analysed across 199 countries and territories, in 21 languages: Arabic, Chinese (Mandarin), Danish, Dutch, English, Estonian, Finnish, French, German, Italian, Japanese, Korean, Lithuanian, Norwegian, Polish, Portuguese, Russian, Spanish, Swedish, Turkish and Vietnamese.
Source: Bloom Consulting and D2 Digital Demand © data, market leader search engines across the world (mobile and desktop)
Pillar 15: Environmental Sustainability
T&T Energy Sustainability subpillar
15.01 T&T GHG intensity
GHG emissions in CO2e kg per US$ of T&T GDP | 2024
GHG emissions include Scope 1, 2 and 3 plus international transport. Transport activity includes all modes of transport.
Source: World Travel & Tourism Council, Sustainable Tourism Global Center, 2026: https://wttc.org/sustainability
15.02 T&T energy intensity
Megajoule of energy, per real US$ of GDP | 2024
Energy sources include Scope 1, 2 and 3 plus international transport.
Source: World Travel & Tourism Council, Sustainable Tourism Global Center initiated by the Ministry of Tourism of Saudi Arabia, 2026: https://wttc.org/sustainability
15.03 T&T use of low-carbon energy
Low carbon energy as a share of total energy usage in travel and tourism | 2024
Low-carbon energy is defined as renewable energy (wind, wave, solar and geothermal), plus hydro and nuclear.
Source: World Travel & Tourism Council, Sustainable Tourism Global Center initiated by the Ministry of Tourism of Saudi Arabia, 2026: https://wttc.org/sustainability
15.04 Renewable energy regulation
Renewable energy pillar score of the RISE index, which gives a snapshot of a country’s policies and regulations in the energy sector | 2023
The renewable energy pillar score is composed of indicators that assess: 1) governance; 2) electricity; 3) heating and cooling; 4) transport; and 5) levelling the playing field. For more information, please see https://rise.esmap.org/analytics.
Source: The World Bank/ESMAP, Regulatory Indicators for Sustainable Energy (RISE)
Pollution and Environmental Conditions subpillar
15.06 Particulate matter (2.5) concentration
Population-weighted exposure to PM 2.5 (micrograms per cubic metre) | 2023
Fine-particle outdoor air pollution (PM 2.5) consists of airborne particles measuring less than 2.5 micrometres in aerodynamic diameter, most often produced as a result of combustion. PM 2.5 concentrations are measured in micrograms of particulate matter per cubic metre of air, or μg/ m3. To estimate concentrations of PM 2.5, Global Burden of Disease (GBD) scientists combine data from 10,408 air-quality monitors representing urban and rural data in 116 countries, satellite observations and global chemical transport models that use data on emissions, chemical reactions and meteorological conditions to estimate the movement and concentration of pollutants. To estimate PM 2.5 exposures for people living in a specific area, scientists combine the number of people living within that area and the PM 2.5 concentration to which they are exposed. This method produces a population-weighted annual average concentration for a given country or region. Population-weighted annual average concentrations are better estimates of population exposures, because they give proportionately greater weight to the air pollution experienced where most people live. For more information, please visit: https://www.stateofglobalair.org/data/estimate-exposure.
Source: Health Effects Institute, State of Global Air 2025, Boston MA
15.07 Level of water stress
Freshwater withdrawal as a proportion of available freshwater sources | 2022
Source: The World Bank, World Development Indicators
15.08 Red List Index
The Red List Index measures changes in aggregate extinction risk across groups of species | 2025
This indicator is based on genuine changes in the number of species in each category of extinction risk on the International Union for Conservation of Nature and Natural Resources (IUCN) Red List of Threatened Species and is expressed as changes in an index ranging from 0 to 1, with 0 meaning all species have gone extinct and 1 meaning all species are classified as Least Concern (i.e. not expected to become extinct in the near future).
Source: United Nations Statistics Division (UNSD), Global SDG Indicators Database
15.09 Forest cover loss
Five-year moving average of annual tree cover loss to forest extent in 2000, in areas with greater or equal to 30% tree cover | 2020 through 2024 moving average
This indicator is calculated by taking the most recent five-year average of annual tree cover loss divided by forest extent in 2000. In this dataset, “tree cover” is defined as all vegetation greater than 5 metres (m) in height and may take the form of natural forests or plantations across a range of canopy densities. “Loss” indicates the removal or mortality of tree cover and can be due to a variety of factors, including mechanical harvesting, fire, disease or storm damage. For more information refer to: https://www.globalforestwatch.org/.
Source: Global Forest Watch
15.10 Proportion of safely treated domestic wastewater flows
Share of domestic wastewater that is safely treated | 2024
This indicator measures share of wastewater volumes (1,000 m3/day), generated through different activities, that are safely treated before being discharged into the environment. Domestic flows are those that are generated from private households.
Source: United Nations Department of Economic and Social Affairs, SDG Indicators Database
15.11 Clean ocean water
Ocean Health Index score for clean waters | 2025
This indicator measures to what degree marine waters under national jurisdictions have been contaminated by chemicals, excessive nutrients (eutrophication), human pathogens and waste. For more information, please see https://dashboards.sdgindex.org/map/indicators/ocean-health-indexclean- waters-score/.
Source: Global Ocean Health Index
Preservation of Nature subpillar
15.12 Number of environmental treaty ratifications
Total number of ratified environmental treaties | 2023
This indicator measures the total number of international treaties from a set of 29 for which a state is a participant. A state is acknowledged as a participant whenever its status for each treaty appears as Ratified, Accession or In Force. The treaties included are: the International Convention for the Regulation of Whaling; the Convention on Wetlands of International Importance especially as Waterfowl Habitat, 1971 Ramsar; the Convention Concerning the Protection of the World Cultural and Natural Heritage, 1972 Paris; the Convention on the Prevention of Marine Pollution by Dumping of Wastes and Other Matter, 1972 London, Mexico City, Moscow, Washington; the Convention on International Trade in Endangered Species of Wild Fauna and Flora, 1973 Washington; the International Convention for the Prevention of Pollution from Ships (MARPOL) as modified by the Protocol of 1978, London; the Convention on the Conservation of Migratory Species of Wild Animals, 1979 Bonn; the United Nations Convention on the Law of the Sea, 1982 Montego Bay; the Convention for the Protection of the Ozone Layer, 1985 Vienna; the Protocol on Substances that Deplete the Ozone Layer, 1987 Montreal; the Convention on the Control of Transboundary Movements of Hazardous Wastes and their Disposal, 1989 Basel; the International Convention on Oil Pollution Preparedness, Response and Co-operation, 1990 London; the United Nations Framework Convention on Climate Change, 1992 New York; the Convention on Biological Diversity, 1992 Rio de Janeiro; the United Nations Convention to Combat Desertification in Those Countries Experiencing Serious Drought and/ or Desertification, particularly Africa, 1994 Paris; the Agreement relating to the Implementation of Part XI of the United Nations Convention on the Law of the Sea of 10 December 1982, 1994 New York; the Agreement relating to the Provisions of the United Nations Convention on the Law of the Sea relating to the Conservation and Management of Straddling Fish Stocks and Highly Migratory Fish Stocks, 1995 New York; the Kyoto Protocol to the United Nations Framework Convention on Climate Change, Kyoto 1997; the Convention on the Law of the Non- Navigational Uses of International Watercourses, 1997; the Rotterdam Convention on the Prior Informed Consent Procedure for Certain Hazardous Chemicals and Pesticides in International Trade, 1998 Rotterdam; the Cartagena Protocol on Biosafety to the Convention on Biological Diversity, 2000 Montreal; the Protocol on Preparedness, Response and Co-operation to Pollution Incidents by Hazardous and Noxious Substances, 2000 London; the Stockholm Convention on Persistent Organic Pollutants, 2001 Stockholm; the International Treaty on Plant Genetic Resources for Food and Agriculture, 2001 Rome; the International Tropical Timber Agreement, 2006 Geneva; the Supplementary Protocol on Liability and Redress to the Cartagena Protocol on Biosafety, 2010 Nagoya – Kuala Lumpur; the Protocol on Access to Genetic Resources and the Fair and Equitable Sharing of Benefits Arising from Their Utilization to the Convention on Biological Diversity, Nagoya 2010; the Convention on Mercury, Minamata, 2013; and the Paris Agreement 2015.
Source: International Union for Conservation of Nature and Natural Resources (IUCN), Environmental Law Centre ELIS Treaty Database (received via direct communication)
15.13 Adequate protection for nature
Response to the survey question: “In your country to what extent is the environment and nature adequately protected?” [1 = Not at all; 7 = To a great extent] | 2024–2025 weighted average
Source: World Economic Forum, Executive Opinion Survey
15.14 Total protected areas coverage
Total square kilometres of terrestrial and marine under protection as a share of the country’s total area | 2026
Based on the IUCN’s definition, a protected area is a clearly defined geographical space, recognized, dedicated and managed, through legal or other effective means, to achieve the long-term conservation of nature with associated ecosystem services and cultural values. Protected areas include nature reserves, wilderness areas, national parks, natural monuments, habitat/species management, protected landscape/seascape and protected areas with sustainable use of natural resources.
Source: United Nations Environment Programme– World Conservation Monitoring Centre (UNEP–WCMC), World Database of Protected Areas
15.15 Average proportion of all key biodiversity areas covered by protected areas
Mean percentage of each terrestrial/freshwater Key Biodiversity Area (KBA) covered by (i.e. overlapping with protected areas and/or OECMs) | 2023
The indicator shows temporal trends in the mean percentage of each important site for terrestrial and freshwater biodiversity (i.e. those that contribute significantly to the global persistence of biodiversity) that is covered by designated protected areas and Other Effective area-based Conservation Measures (OECMs).
Source: BirdLife International, International Union for Conservation of Nature and Natural Resources (IUCN) and United Nations Environment Programme–World Conservation Monitoring Centre (UNEP–WCMC)
Pillar 16: T&T Socioeconomic Impact
16.01 T&T GDP multiplier
Ratio of indirect and induced tourism GDP to direct travel and tourism GDP contribution | 2023, 2024, 2025 moving average
Direct contribution reflects internal travel and tourism spending, which includes resident and non-resident spending on industry services. Total contribution reflects wider sector impact on an economy such as spending on supply-chain goods and consumer spending of sector and supplier employees.
Source: World Travel & Tourism Council, Travel & Tourism Economic Impact Research 2026: https://researchhub.wttc.org/
16.02 T&T employment multiplier
Ratio of indirect and induced tourism employment to direct travel and tourism employment contribution | 2023, 2024, 2025 moving average
Source: World Travel & Tourism Council, Travel & Tourism Economic Impact Research 2026: https://researchhub.wttc.org/
16.03 T&T high-wage jobs
Proportion of direct T&T jobs that are in high-wage sectors | 2024
High-wage sectors are defined as those in which average wages are roughly in the top third of earnings in a given country (above the 65th percentile).
Source: World Travel & Tourism Council, Sustainable Tourism Global Center initiated by the Ministry of Tourism of Saudi Arabia, 2026: https://wttc.org/sustainability
16.04 T&T labour gender parity
Absolute difference between male and female share of direct travel and tourism employment | 2024
Source: World Travel & Tourism Council, Sustainable Tourism Global Center initiated by the Ministry of Tourism of Saudi Arabia, 2026: https://wttc.org/sustainability
Pillar 17: T&T Demand Sustainability
17.01 Inbound length of stay
Length of stay refers to the number of days spent in the destination country | 2023, 2024, 2025 moving average
Source: Euromonitor International
17.02 Seasonality of international tourist arrivals
Top three months’ share of total yearly international tourist arrivals | 2024, 2025 moving average
International tourist arrivals are defined as tourists who travel to a country other than that in which they have their usual residence, but outside their usual environment, for a period not exceeding 12 months and whose main purpose in visiting is other than an activity remunerated from within the country visited.
Source: United Nations World Tourism Organization (UN Tourism)
17.03 Concentration of interest in cultural attractions
Share of an economy’s total page views that its top 10% of viewed cultural attractions received on Tripadvisor | 2023, 2024, 2025 year end August moving average
This indicator acts as a proxy for potential overcrowding at attractions. Cultural attractions include places of worship and other religious sites, historic walking areas, ancient ruins, educational sites, military bases/facilities, missions, libraries, civic centres, mines, castles, government buildings, historic sites, cemeteries, battlefields, scenic/historic walking areas, neighbourhoods and ghost towns. Economies that have 10 or fewer attractions are excluded. Data is received by direct communication.
Source: Tripadvisor
17.04 Concentration of interest in nature attractions
Share of an economy’s total page views that its top 10% of viewed nature attractions received on Tripadvisor | 2023, 2024, 2025 year end August moving average
This indicator acts as a proxy for potential overcrowding at attractions. Nature and park attractions include nature/wildlife areas, islands, beaches, playgrounds, national parks, forests, dams, biking trails, waterfalls, off-road/all-terrain vehicle trails, hot springs/geysers, geologic formations, motorcycle trails, state parks, equestrian trails, volcanoes, bodies of water, parks, caverns/caves, gardens, valleys, mountains, zoos, ski/snowboarding areas, canyons, reefs, hiking trails, marinas, aquariums, deserts, other nature and parks. Economies that have 10 or fewer attractions are excluded. Data is received by direct communication.
Source: Tripadvisor
17.05 Geographically dispersed tourism
Response to the survey question: “In your country, to what extent are foreign visitors (tourists and business travellers) dispersed throughout the country?” [1 = Visitors are heavily concentrated in a few destinations; 7 = Visitors are equally distributed throughout the country] | 2024–2025 weighted average
Source: World Economic Forum; Executive Opinion Survey
Appendix C: Income group and regional classifications
Income group classifications, 2026
The following income group classifications were used for the index and report.
Table C1: Per capita income classifications
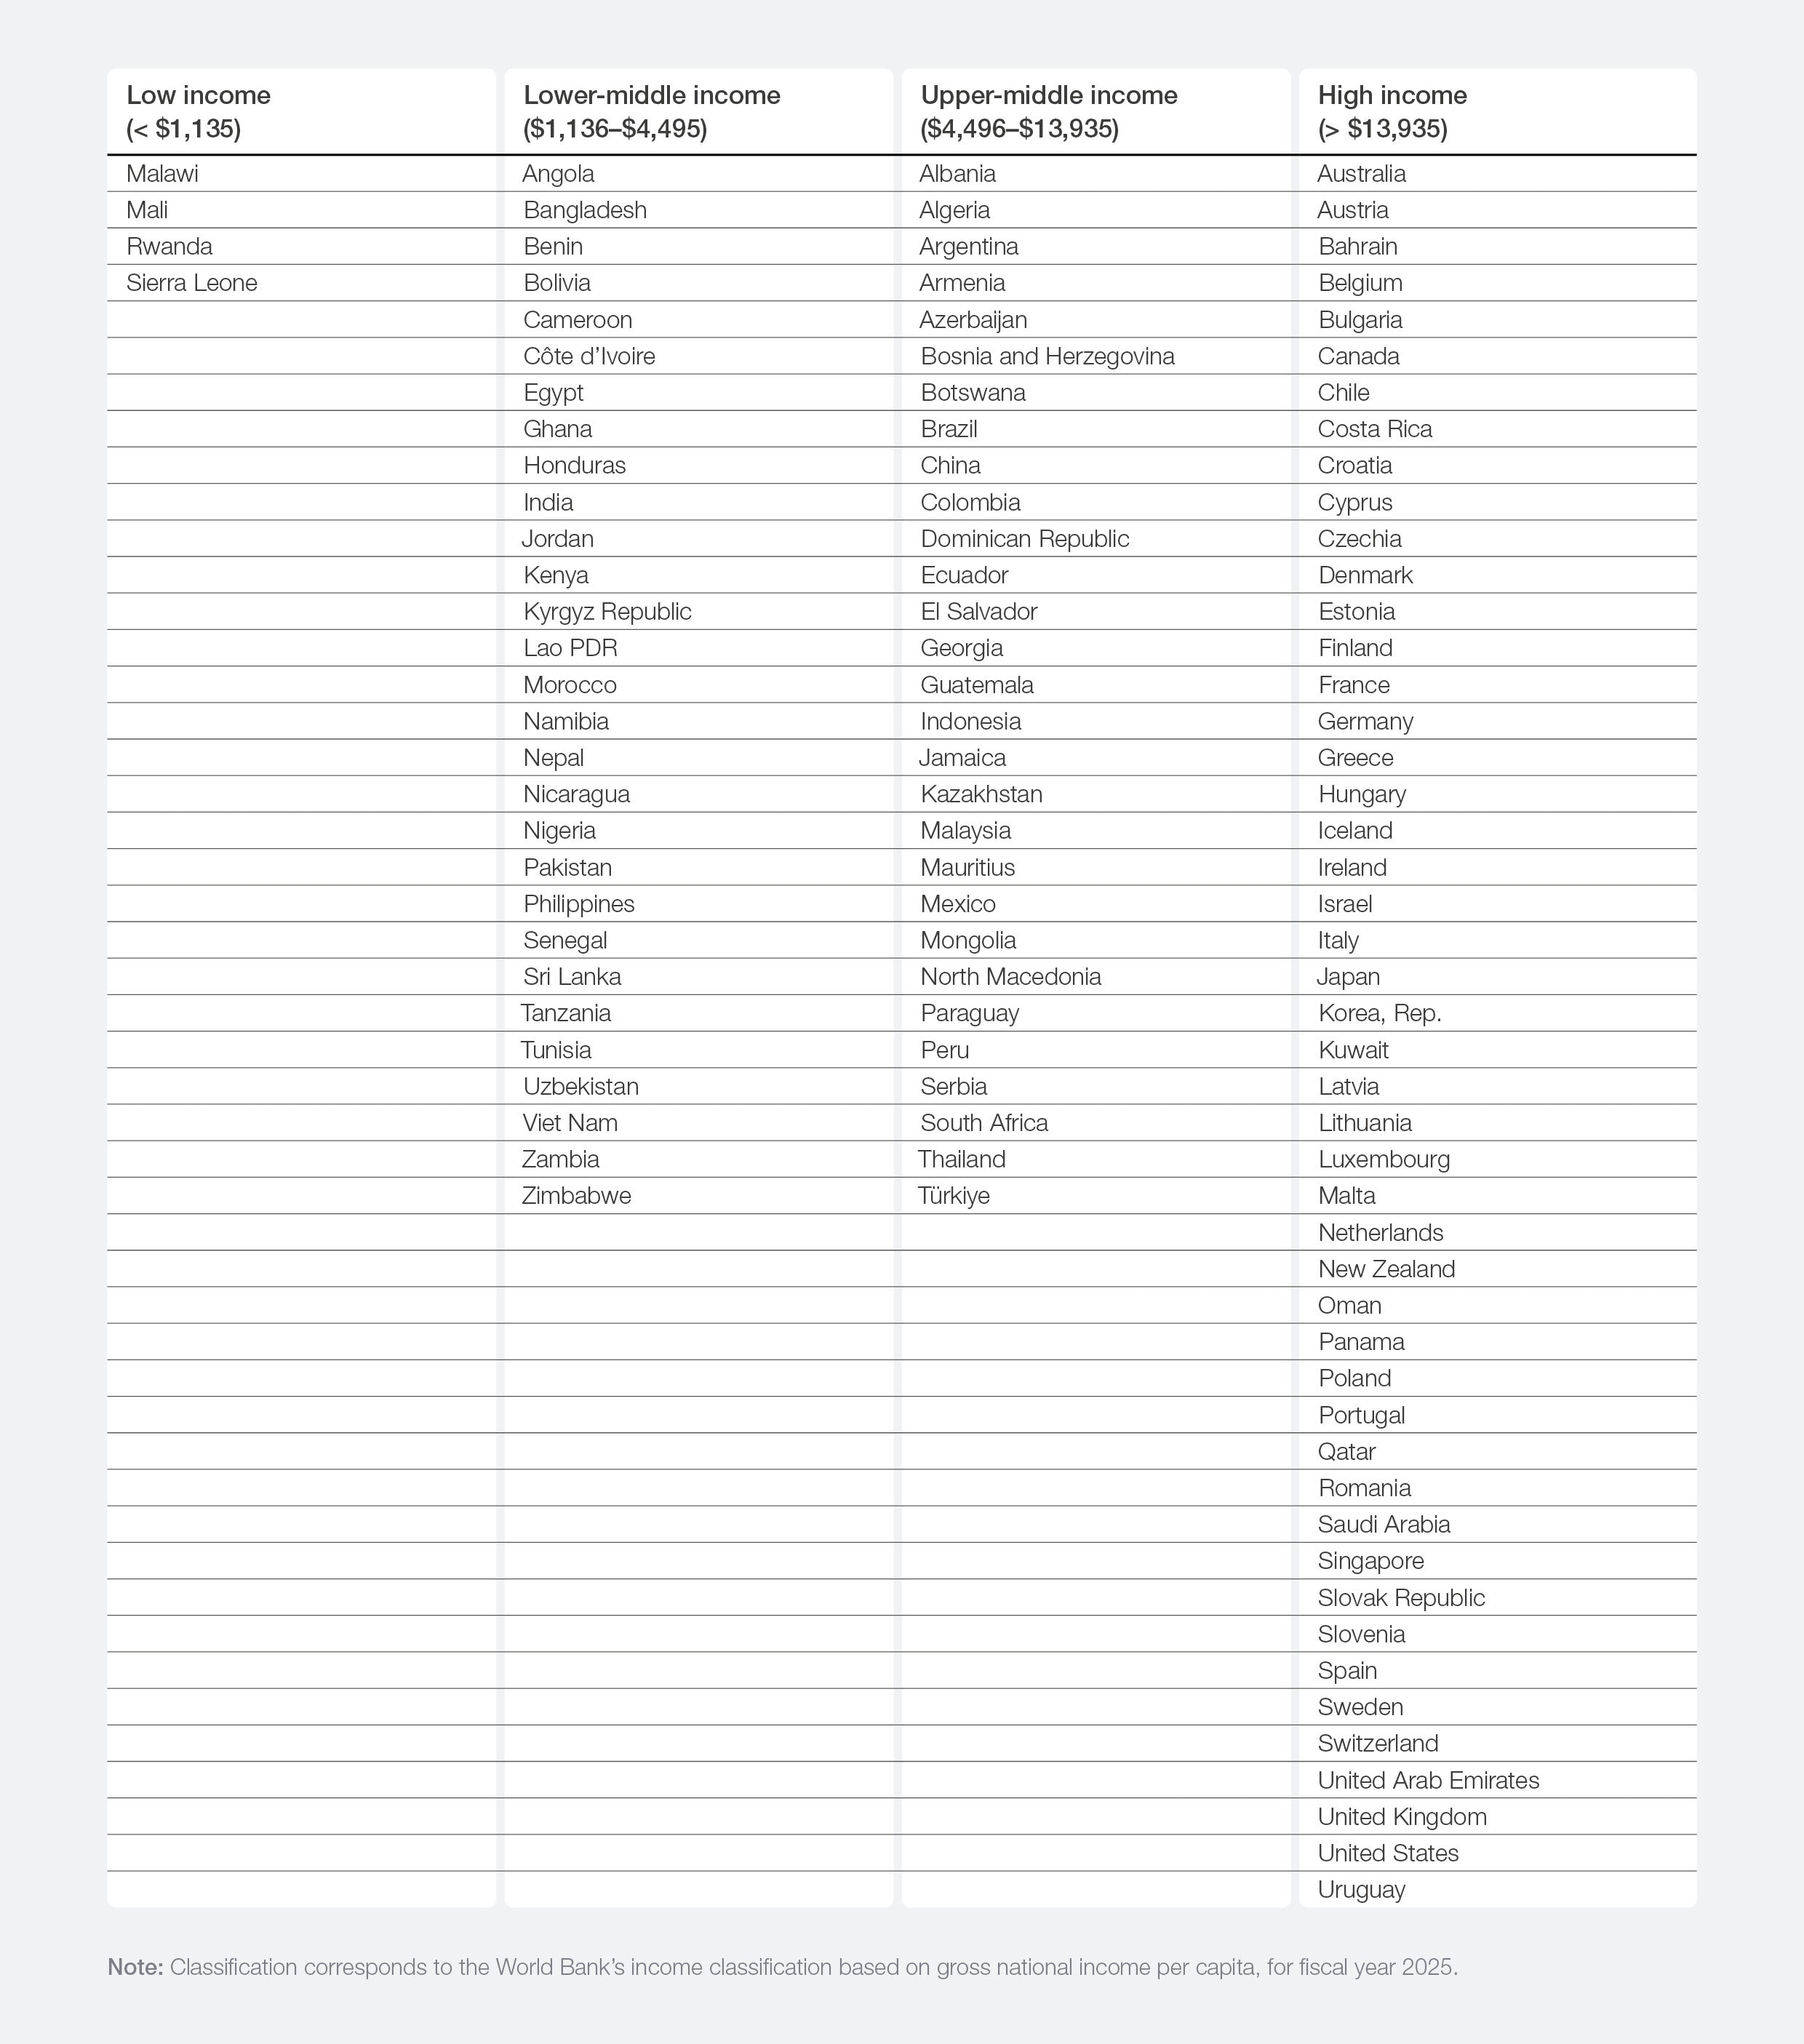

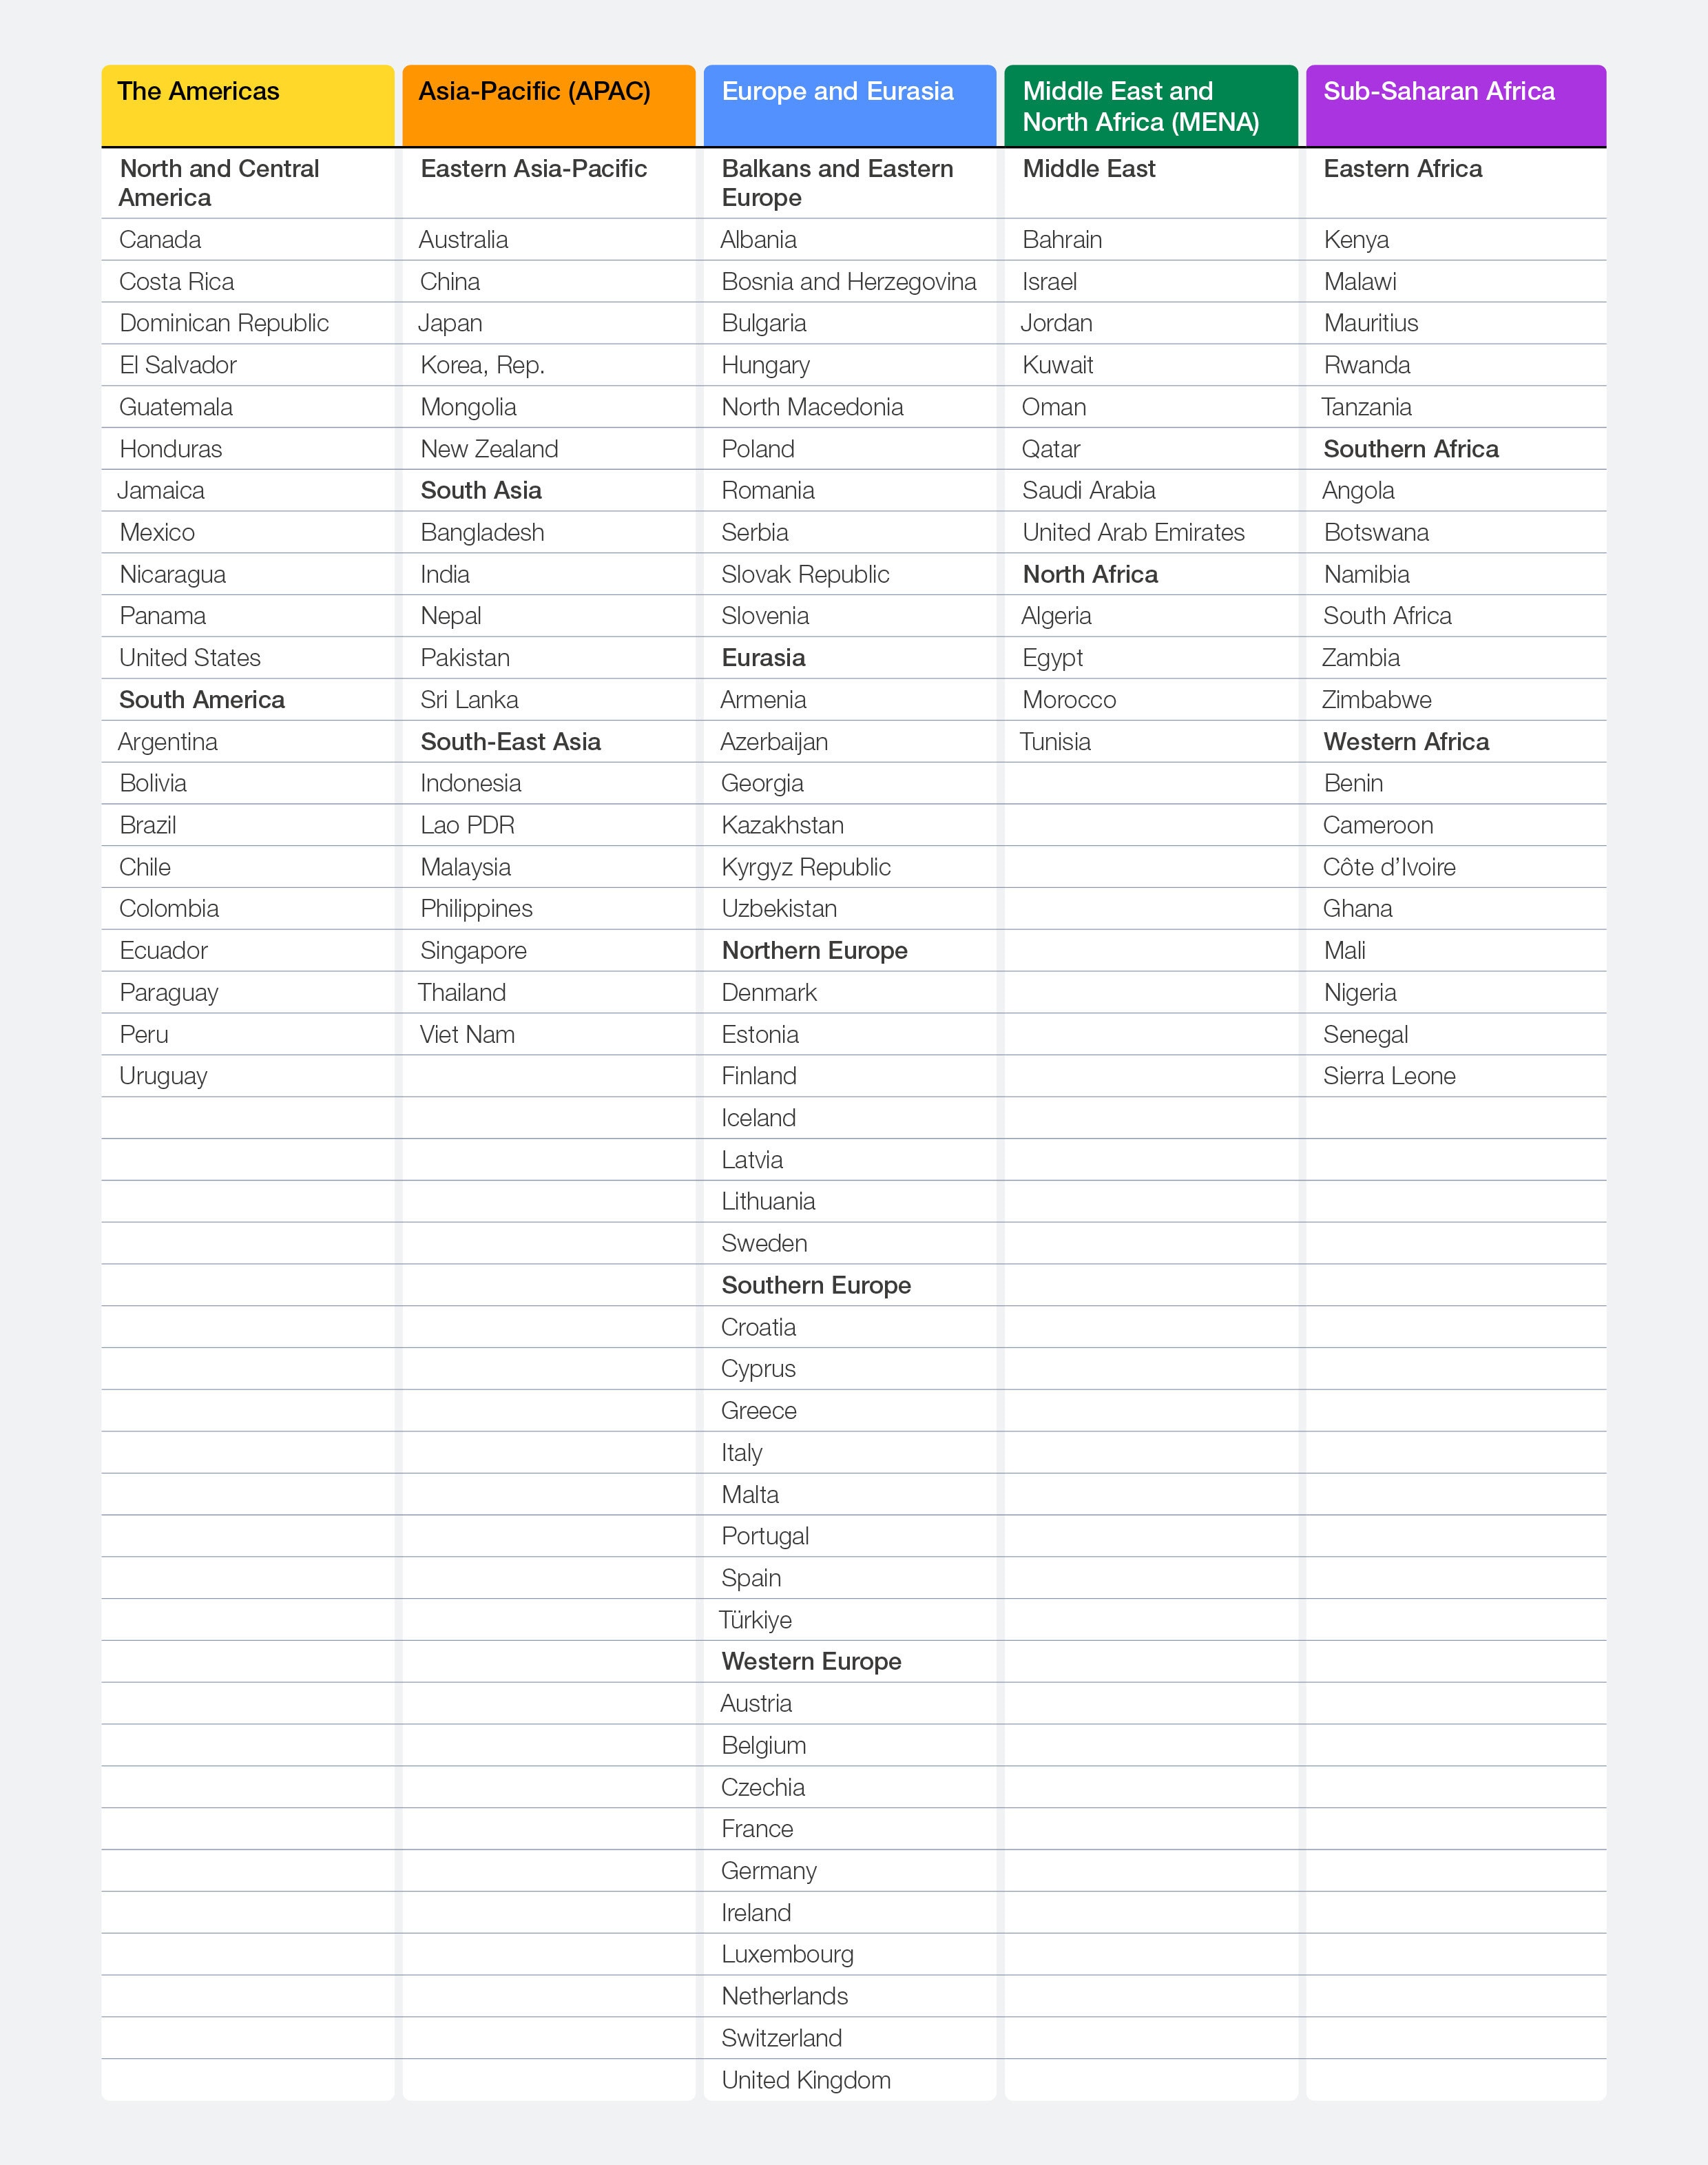
Table C2: Regional group classifications, 2026

Appendix D: Partner Institutes
The World Economic Forum’s Centre for the New Economy and Society is pleased to acknowledge and thank the following organizations as its valued Partner Institutes, without which the realization of the Travel & Tourism Development Index 2026 would not have been feasible:
Algeria
Centre de Recherche en Economie Appliquée Pour Le Développement (CREAD)
Yacine Belarbi, Director
Khaled Menna, Director of Macroeconomics and Economic Integration
Angola
Jobartis
João Freitas, Country Manager
Luis Verdeja, Director
Argentina
IAE Business School, Universidad Austral
Eduardo Fracchia, Full Professor, Department of Economics and Finance
Martin Calveira, Research Economist
Armenia
CIVITTA Institution Research Center NGO
Sevak Hovhannisyan, Board Member and Senior Associate
Australia, Belgium, Canada, France, Germany, Indonesia, Italy, the Philippines, Sweden, Taiwan, Province of China, United Kingdom, United States
Dynata
Thomas Huff, Senior Project Manager
Steffen Bott, Vice-President, Sales
Valentyna Chuikina, Associate Account Director
Austria
Austrian Institute of Economic Research (WIFO)
Gabriel Felbermayr, Director
Michael Peneder, Project Lead
Alexandros Charos, Survey Expert
Azerbaijan
Azerbaijan State University of Economics (UNEC)
Nasimi Ismayilov, Vice-Rector for Economic Affairs
Sevinj Majid, Head of UNEC Career Center
Gultaj Tahirli, Specialist of Project Management Office
Ulkar Ibrahimli, Senior Specialist of UNEC Career Center
Ayten Aghayeva, Specialist of UNEC Career Center
Bahamas
The Government and Public Policy Institute, University of the Bahamas
Zhivargo Laing, Executive Director
Jeannie D. Gibson, Policy Assistant
Bahrain
Bahrain Economic Development Board
Noor bint Ali AlKhulaif, Minister of Sustainable Development, Chief Executive of the Economic Development Board
Nada Al-Saeed, Chief of Strategy
Rima AlKilani, Executive Director, Projects
Redha AlAnsari, Executive Director, Research
Fatema AlAtbi, Head, Research
Sara Ishaq, Senior Executive, Research
Bangladesh
Centre for Policy Dialogue (CPD)
Fahmida Khatun, Executive Director
Khondaker Golam Moazzem, Research Director
Jebunnesa (Jeba), Programme Associate
Maleehah Sabah Ali, Programme Associate
Benin
Institut de Recherche Empirique en Economie Politique (IREEP)
Leonard Wantchekon, President
Stéphania Houngan, Research Associate
Bolivia, Costa Rica, Dominican Republic, El Salvador, Honduras, Panama
INCAE Business School
Ronald Arce, Director
Enrique Bolaños, President
Bosnia and Herzegovina
School of Economics and Business, University of Sarajevo
Jasmina Selimovic, Dean
Zlatko Lagumdzija, Professor
Amra Kapo, Associate Professor
Botswana
Botswana National Productivity Centre
Sethunya Kegakgametse, Research Consultant
Letsogile Batsetswe, Research Consultant and Statistician
Zelda Okatch, Information and Research Services
Manager
Matlho Kgosi, Executive Director (Acting)
Brazil
Fundação Dom Cabral
Hugo Tadeu, Director and Professor at the FDC Innovation, AI and Digital Center
Jersone Tasso, Professor at the FDC Innovation, AI and Digital Center
Bruna Diniz, Research Assistant at the FDC Innovation, AI and Digital Center
Kauã Kenner, Research Assistant at the FDC Innovation, AI and Digital Center
Brunei Darussalam
Universiti Teknologi Brunei (UTB)
Datin Paduka, Professor
Dayang Hajah Zohrah binti Haji Sulaiman, Vice-Chancellor
Mohamad Saiful bin Haji Omar, Assistant Vice-Chancellor (External and Industry Relations)
Hajah Siti Wardah binti Haji Abd Rahman, Project Coordinator
Bulgaria
Center for Economic Development
Maria Prohaska, Director
Ivalina Simeonova, Project Manager
Cameroon
Compétitivité Cameroon
Hermann Fotie Ii, Permanent Secretary
Tanankem Belmondo Voufo, Expert Investment Climate
Jean Baptiste Nsoe Nkouli, Competitiveness Observatory Expert
Cape Verde
INOVE Research
Frantz Tavares, Chief Executive Officer
Jerónimo Freire, Project Manager
Júlio Delgado, Director
Chad
Groupe de Recherches Alternatives et de Monitoring du Projet Pétrole-Tchad-Cameroun
Simael Mbairassem, Economist in charge of Research and Public Policies
Maoundonodji Gilbert, Managing Director
Chile
University Adolfo Ibañez Business School
Rodrigo Wagner, Associate Professor of Finance
Colombia
National Planning Department of Colombia
Natalia Irene Molina Posso, General Director, Department of National Planning
Tatiana Zambrano Sanchez, Technical Director, Innovation and Private Sector Development
Sara Patricia Rivera, Adviser, Innovation and Private Sector Development
Congo, Democratic Republic of the
Congo-Invest Consulting
Teza Bila Minlangu, Administrator
Faila Tabu Ngandi, Managing Director
Bertin Muderhwa, Head of Service in charge of Studies and Statistics at the Federation of Businesses of Congo
Côte d’Ivoire
Centre de Promotion des Investissements en Côte D’ivoire (CEPICI)
Solange Amichia, Chief Executive Officer
Ramatou Fall, Director of Business Climate
Simon Meledje, Head of Planning and Monitoring
Bernadine Yeble N’Guessan, Research Officer
Cyprus
Cyprus Employers and Industry Confederation (OEB)
Antonis Frangoudis, Director Business Development and Economic Affairs Department
Bank of Cyprus
Kyriacos Antoniou, Governance Officer
Andreas Alexandrou, Manager Strategy and Customer Insights
Czechia
Czechia CMC Graduate School of Business
Tomáš Janča, Executive Director
Denmark
Danish Technological Institute
Stig Yding Sørensen, Senior Specialist
Andreas Bjerre Lunkeit, Consultant
Ecuador
ESPAE Graduate School of Management (ESPOL)
María Luisa Granda, Dean of ESPAE-ESPOL
Tania Tenesaca, Project Coordinator
Egypt
Egyptian Center for Economic Studies (ECES)
Abla Abdel Latif, Executive Director, and Director of Research
Salma Bahaa El Din, Senior Economist
Ahmed Maged, Research Assistant
Hossam Khater, Research Assistant
Mohamed Khater, Research Assistant
Estonia
Estonian Institute of Economic Research (EKI)
Peeter Raudsepp, Director
Finland
ETLA Research Institute of the Finnish Economy
Aki Kangasharju, Managing Director
Päivi Puonti, Head of Forecasting
Ville Kaitila, Senior Researcher
Georgia
Grigol Robakidze University
Vakhtang Charaia, Vice-Rector
Tengiz Taktakishvili, Expert
Giga Tvauri, Expert
TSU Center for Analysis and Forecasting
Mariam Lashkhi, Project Manager
Otar Anguridze, Head of the Board
Ghana
Association of Ghana Industries
Yaw Adu-Gyamfi, President
Seth Twum-Akwaboah, Chief Executive Officer
John Defor, Director, Policy and Research
Greece
SEV Hellenic Federation of Enterprises
Michael Mitsopoulos, Director, Business Licensing, Spatial Planning & Infrastructure
Athanasios Printsipas, Senior Adviser, Labour Affairs and Social Dialogue
Guatemala
FUNDESA
Jose Miguel Torrebiarte, President of the Board of Directors
Juan Carlos Zapata, Chief Executive Officer
Fernando Spross, Associate Researcher
Paola Sosa, Corporate Affairs Coordinator
Hong Kong SAR, China
Hong Kong General Chamber of Commerce
Simon Ngan, Director, Policy and Research
Wilson Chong, Senior Economist
Hungary
KOPINT-TÁRKI Economic Research
Peter Vakhal, Senior Research Associate
Éva Palócz, Chief Executive Officer
India
LeadCap Knowledge Solutions – LeadCap Ventures
Sangeeth Varghese, Managing Director and Chief Executive Officer
Vidyadhar Prabhudesai, Director and Chief Operating Officer
Iraq
Baghdad Economic Forum
Faris Raheem Aal-Salman, Chairman of the Board of Directors
Thabit Kadhim Khudhur, Vice-Chairman of the Board of Directors
Ireland
Irish Business and Employers Confederation (IBEC)
Geraldine Anderson, Head of Research
Israel
Manufacturers’ Association of Israel (MAI)
Ron Tomer, President
Ruby Ginel, Chief Executive Officer
Dan Catarivas, General Manager, Foreign Trade and International Relations Division
Itai Nakash, Deputy General Manager, Foreign Trade and International Relations Division
Jamaica
Mona School of Business and Management (MSBM), The University of the West Indies, Mona
David McBean, Executive Director
Yvette Cameron-Harris, Project Administrator
Jamaica Promotions Corporation (JAMPRO)
Shulette Cox, Vice-President, Research, Advocacy, and Project Implementation
National Competitiveness Council Jamaica
Sharifa Powell, Consultant Project Manager
Japan
Waseda University
Jusuke Ikegami, Professor
Mitsuyo Tsubayama, Coordinator
Shoko Miya, Coordinator
Aiko Hatano, Coordinator
Jordan
Ministry of Planning and International Cooperation
Omar Fanek, Director
Mira Mango, Head of Competitiveness and International Indicators Division
Kazakhstan
Center for Strategic Initiatives
Olzhas Khudaibergenov, Senior Partner
Yerbol Tulegenov, Associate Partner
Symbat Aliaskarova, Consultant
Kenya
University of Nairobi
Karuti Kanyinga, Research Professor and Director, Institute of Development Studies (IDS)
Vincent Mugo, Project Assistant, IDS
Paul Kamau, Associate Research Professor, IDS
Korea, Rep.
Korea Development Institute
Inho Song, Executive Director, Economic Information and Education Center
Eunhee Kim, Head, Public Opinion Analysis Unit
Boyoung Han, Senior Research Associate, Public Opinion Analysis Unit
Kosovo and North Macedonia
Economic Chamber of North-West Macedonia
Durim Zekiri, Executive Director
Miranda Ajdini, Operations Manager
Besiana Mustafa, Business Liaison Officer
Genta Latifi, Associate for Research and Analysis
Kuwait
Kuwait University
Fahad Al-Rashid, Committee Chair
Adel Al-Husainan, Committee Member
Majed Jamal Al-Deen, Committee Member
Kyrgyz Republic
Economic Policy Institute
Marat Tazabekov, Chairman
Lao PDR
Enterprise and Development Consultants (EDC)
Buakhai Phimmavong, Managing Partner
Thipphasone Inthachack, Office Administrator
Latvia
Stockholm School of Economics in Riga
Arnis Sauka, Head of the Centre for Sustainable Development
Lesotho
Private Sector Foundation of Lesotho (PSFL)
Thabo Qhesi, Chief Executive Officer
Bokang Tsoanamatsie, Public Relations Officer
Qothoase Khofane, Researcher
Liberia and Sierra Leone
GQRDOTCOM (GQR)
Omodele Jones, Chief Executive Officer
Lithuania
Innovation Agency Lithuania
Jone Kalendiene, Head of Research and Analysis Division
Irena Karelina, Analyst
Luxembourg
Luxembourg Chamber of Commerce
Christel Chatelain, Head of Economic Affairs
Sidonie Paris, Economist
Anthony Villeneuve, Economist
Malawi
Malawi Confederation of Chambers of Commerce and Industry
Daisy Kambalame, Chief Executive
Lucky Mfungwe, Director of Business Environment
Chancy Mkandawire, Economic Analyst
Blessings Kalulu, Economic Analyst
Malaysia
Malaysia Productivity Corporation (MPC)
Datuk Zahid Ismail, Director General
Mazrina Mohamed Ibramsah, Deputy Director General
Mohamad Norjayadi Tamam, Deputy Director General
Wan Fazlin Nadia Wan Osman, Director
Mohammed Alamin Rehan, Director
Mali
Mali Applied and Theoretical Economics Research Group (GREAT)
Massa Coulibaly, Executive Director
Wélé Fatoumata Binta Sow, Researcher
Badiégué Diallo, Administrative and Financial Assistant
Malta
Competitive Malta – Foundation for National Competitiveness
Adrian Said, Associate
Matthew Castillo, Associate
Mauritius
Economic Development Board
Mahen Abhimanu Kundasamy, Chief Executive Officer
Yudeeshen Narayanan, Manager
Mexico
Instituto Mexicano para la Competitividad (IMCO)
Valeria Moy, General Director
Isabel Madrazo, Program Manager
Ministry of the Economy
Jorge Eduardo Arreola Cavazos, General Director for Competitiveness and Competition
Carlos Rubén Altamirano Márquez, Director
Fernando Tonatiuh Parra Calvo, Underdirector for Competitiveness
Mongolia
Open Society Forum (OSF)
Erdenejargal Perenlei, Executive Director
Oyunbadam Davaakhuu, Program Manager
Montenegro
The Institute for Strategic Studies and Prognoses (ISSP)
Maja Drakic Grgur, Project Coordinator
Veselin Vukotic, President
Morocco
The Policy Centre for the New South
Karim El Aynaoui, Executive President
Asmaa Tahraoui, Senior Knowledge Manager
Abdelaaziz Ait Ali, Head, Economics Research Department
Namibia
Institute for Public Policy Research (IPPR)
Tia-Zia Garoes, Office Manager
Suzie Shefeni, Research Associate
Nepal
Competitiveness and Development Institute (CODE)
Ramesh C. Chitrakar, Project Director/Country Coordinator
Abhinandan Baniya, Associate Team Member
Menaka Shrestha, Team Member
Netherlands
Amsterdam Centre for Business Innovation, University of Amsterdam
Henk Volberda, Director and Professor
Rick Hollen, Senior Research Associate
Raoul Breij, Research Assistant
Nigeria
Nigerian Economic Summit Group (NESG)
Tayo Aduloju, Chief Executive Officer
Olusegun Omisakin, Director of Research and Development
Sodik Olofin, Economist
Oman
National Competitiveness Office (NCO)
Salim Abdullah Al Shaikh, Acting Chief
Juhaina Saleh Al Balushi, Economic Researcher
Jawaher Sultan Al Habsi, Business Analyst
Pakistan
Mishal Pakistan
Amir Jahangir, Chief Executive Officer
Puruesh Chaudhary, Director
Paraguay
Paraguayan Foundation for Cooperation and Development
Martin Burt, Chief Executive Officer
Luis Fernando Sanabria, Chief Executive Officer
Sol Urbieta, Management Assistant
Peru
Industrial Development Center of the National Society of Industries
Luis Tenorio, Executive Director
Maria Elena Baraybar, Project Assistant
Benoni Sanchez, Head of Systems
Poland
National Bank of Poland
Piotr Boguszewski, Economic Adviser
Piotr Szpunar, Director
Portugal
Business Administrators Forum (FAE)
Paulo Carmona, President
Mariana Marques dos Santos, Member of the Board
PROFORUM Association for the Development of Engineering
Ilidio De Ayala Serôdio, Vice-President
Helena Roquette, Secretary
Qatar
Qatari Businessmen Association (QBA)
Sheikh Faisal Bin Qassim Al Thani, Chairman
Issa Abdulsalam Abu Issa, Secretary General
Sarah Abdallah, Deputy General Manager
Romania
Association for Women Entrepreneurship Development (ADAF)
The Chamber of Commerce and Industry of Romania
Rotaru Cornelia, President
Rotaru Gela, Business Analyst
Savu Cristina, Communication Expert
Rwanda
Rwanda Development Board
Delphine Uwase, Acting Head of Strategy and Competitiveness Department
Kennedy Kalisa, Strategy Analyst
Richard Kayibanda, Acting Chief Strategy and Compliance Officer
Saudi Arabia
Alfaisal University
Mohammed Kafaji, Director of Alfaisal Competitiveness Center
National Competitiveness Centre
Eiman Habbas Al-Mutairi, Chief Executive Officer of the National Competitiveness Center
Waleed AlRudaian, Vice-President
Salman M. AlTukhaifi, General Manager of Analytics & Business Intelligence
Senegal
Université Cheikh Anta Diop of Dakar
Thierno Thioune, Directeur du Centre de Recherches Economiques Appliquées
Serbia
Foundation for the Advancement of Economics (FREN)
Aleksandar Radivojević, Coordinator
Dejan Molnar, Director
Singapore
Singapore Economic Development Board
Cheng Wai San, Director and Head
Teo Xinyu, Manager
Ripply Cheong, Executive Officer
Slovak Republic
Business Alliance of Slovakia (PAS)
Peter Serina, Executive Director
Robert Kičina, Member of the Board
Slovenia
Institute for Economic Research
Damjan Kavaš, Director
Sonja Uršič, Senior Research Assistant
University of Ljubljana, Faculty of Economics
Mateja Drnovšek, Full Professor
South Africa
Business Unity South Africa
Tyson Thamsanqa Sibanda, Economic Policy Manager
Lunga Maloyi, Economic Policy Executive Director
Khulekani Mathe, Chief Executive Officer
Spain
IESE Business School
Pascual Berrone, Professor, Director of the International Center for Competitiveness
María Luisa Blázquez, Research Associate
Sri Lanka
Institute of Policy Studies of Sri Lanka (IPS)
Kithmina Hewage, Research Economist
Tharindu Udayanga, Research Assistant
Switzerland
University of St Gallen, Center for Financial Services Innovation
Tobias Trütsch, Managing Director
Tanzania
REPOA
Donald Mmari, Executive Director
Lucas Katera, Director of Collaborations and Capacity Building
Cornel Jahari, Researcher and Field Manager
Thailand
Chulalongkorn University
Wilert Puriwat, President
Kanyarat (Lek) Sanoran Assistant to the President
Tunisia
Institut Arabe des Chefs d’Entreprises
Majdi Hassen, Executive Director
Hager KARAA, Head of Studies Department
Türkiye
TÜSIAD, Sabanci University Competitiveness Forum (REF)
Esra Durceylan Kaygusuz, Director
Kübra Atik, Doctoral Student
Ukraine
CASE Ukraine, Center for Social and Economic Research
Dmytro Boyarchuk, Executive Director
Vladimir Dubrovskiy, Leading Economist
Oksana Kuziakiv, Senior Adviser
United Arab Emirates
Federal Competitiveness and Statistics Centre
Hanan Ahli, Managing Director of Federal Competitiveness and Statistics Centre
Department of Economic Development, Abu Dhabi
Hamad Sayah Al Mazrouei, Undersecretary of Department of Economic Development, Abu Dhabi
Uruguay
Universidad ORT Uruguay
Isidoro Hodara, Professor
Bruno Gili, Professor
Federico Monetti, Professor
Venezuela
Venezuelan Council for Investment Promotion
Jennyn Osorio, Economics Affairs Manager
Jorge García, Business Intelligence Manager
Viet Nam
Ho Chi Minh City Institute for Development Studies (HIDS)
Tran Hoang Ngan, Director
Trieu Thanh Son, Head of Research Management
Nguyen Manh Quan, Researcher
Yemen, Rep.
Yemeni Business Club (YBC)
Fathi Abdulwase Hayel Saeed, Chairman
Ghadeer Ahmed Almaqhafi, Executive Director
Safa Abdullah Alsayaghi, Projects Manager
Zambia
University of Zambia
Joseph Simbaya, Director
Chitalu Chama Chiliba, Assistant Director and Senior Research Fellow
Patricia Funjika, Research Fellow
Zimbabwe
National Competitiveness Commission
Phillip Phiri, Executive Director
Brighton Shayanewako, Director, Competitiveness
Douglas Muzimba, Chief Economist, International Competitiveness
Elizabeth Magwaza, Economist