Travel & Tourism Development Index 2026


3. Global performance trends
The foundations of T&T growth are stronger than ever, yet rising costs, economic and geopolitical uncertainty, and mounting sustainability pressures threaten future progress.
Section takeaways
- Global travel and tourism development conditions are at their strongest since the pandemic: Between 2024 and 2026, 14 of 17 pillars improved and average TTDI scores rose by 2%, the fastest pace of improvement since 2019. Strong gains in cultural attractions, tourism infrastructure and services, and air connectivity reinforced the foundations that support tourism growth.
- Destinations are becoming easier to access and more digitally enabled: ICT Readiness was one of the most improved pillars, with 91% of economies recording higher scores. Greater travel openness is expanding opportunities for travellers, while AI is reshaping how destinations compete, raising the importance of digital infrastructure, workforce skills and data capabilities.
- Affordability pressures are intensifying as investment and workforce gaps persist: Price Competitiveness declined in three-quarters of TTDI-ranked economies between 2024 and 2026 as travel costs outpaced inflation. In the meantime, despite improvement, tourism investment has lagged behind demand since 2022, while workforce shortages and skills gaps risk limiting service quality and the sector’s ability to grow and adapt.
The TTDI measures the factors and policies that enable the sustainable and resilient development of the sector rather than tourism outcomes such as visitor volumes or traveller spending. The 2026 results point to broad-based strengthening of enabling conditions for T&T growth. Between the 2024 and 2026 editions, 92% of ranked economies improved their overall TTDI score, compared with around 54% between 2021 and 2024, while average performance increased by around 2.1%, up from 0.2% in the previous reporting cycle. These results represent the strongest improvement since the pandemic, indicating that T&T development conditions are strengthening across much of the world.
Despite global economic and geopolitical concerns, the past two years have seen rising demand and the development of cultural, natural and non-leisure resources, greater air capacity and connectivity, and continued expansion in tourism infrastructure. Some of the strongest gains were recorded in Asia- Pacific as the region continued to recover from its delayed post-pandemic reopening.
Nonetheless, the results also point to mounting pressure from rising prices, economic and investment uncertainty, and sustainability challenges, creating headwinds for the continued development of the T&T sector.
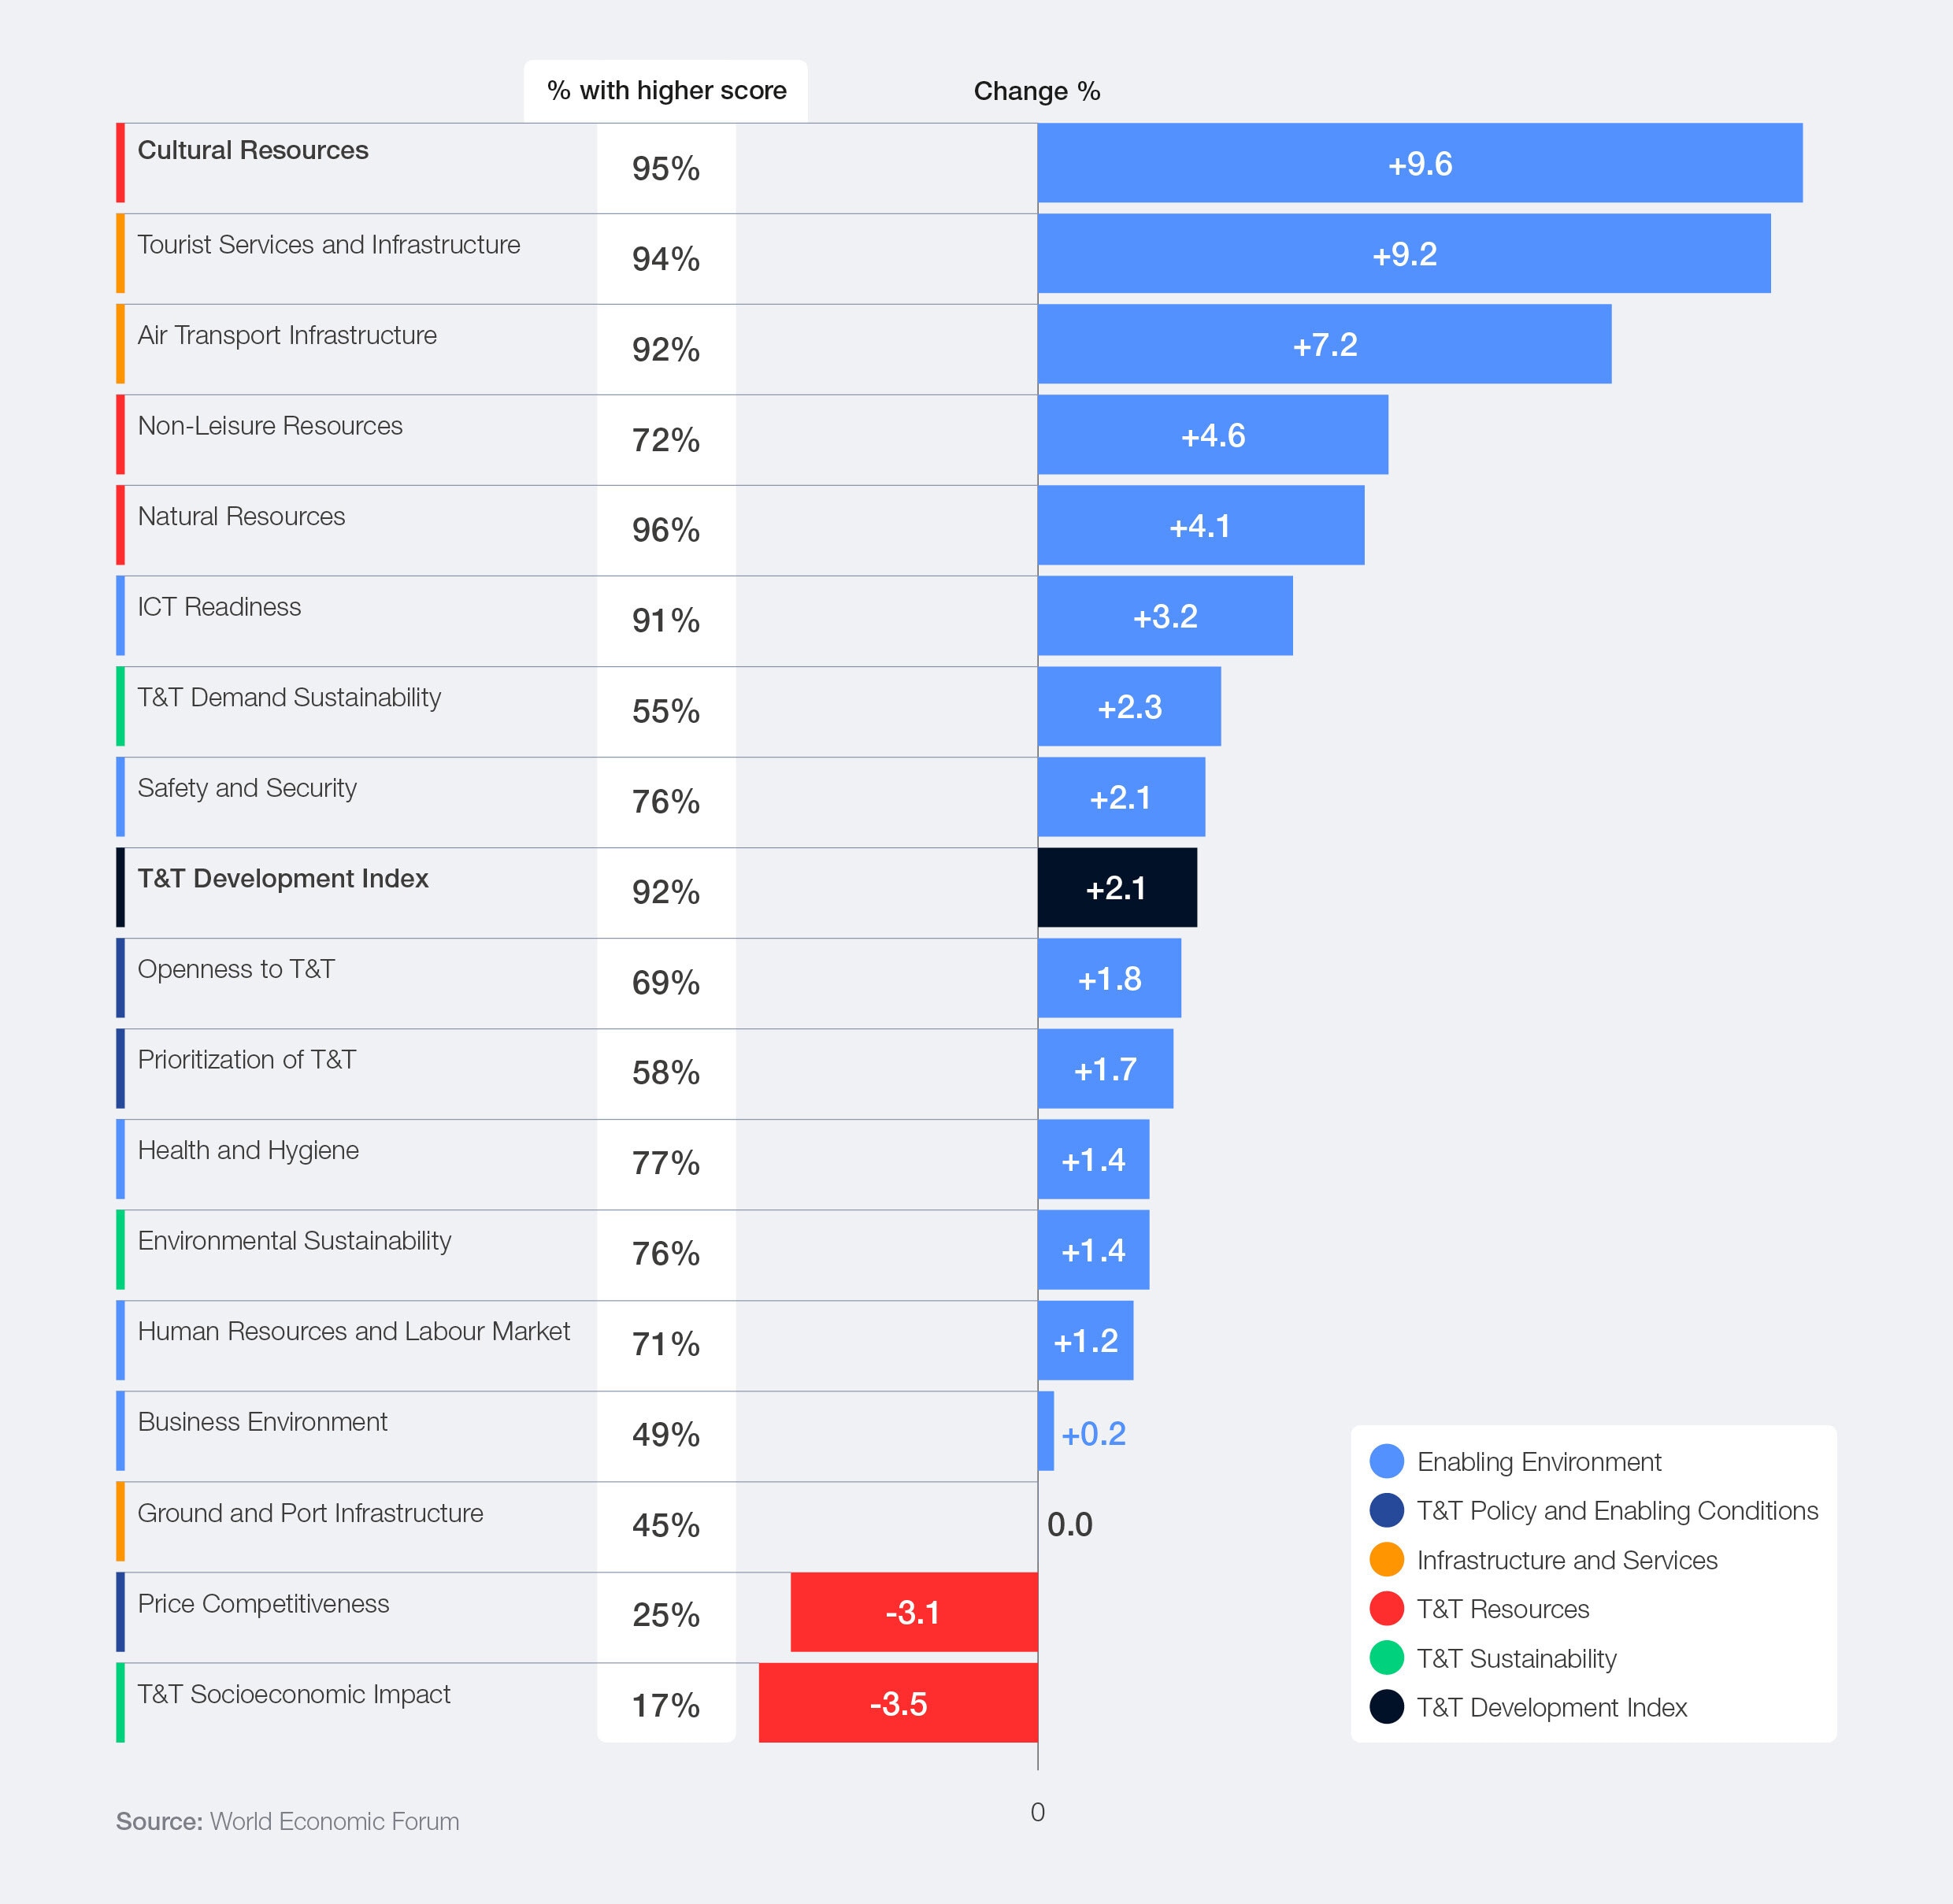
Figure 3: Change in TTDI pillar scores (%), 2024–2026

3.1 Travel and tourism development conditions are strengthening
Travel opportunities and attractions are expanding
Among the strongest and most widespread improvements were those seen in the Cultural, Natural and Non-Leisure Resources pillars (see Figure 3), indicating continued development and expansion of attractions and travel opportunities across leisure, business, educational and institutional travel.
Cultural Resources was the most improved pillar in the TTDI. Average scores increased by 9.6% between the 2024 and 2026 index editions, with over 95% of economies recording higher scores. The largest gains were recorded in South-East Asia (+26.5%), North Africa (+18.0%) and the Balkans and Eastern Europe (+12.8%).
This partly reflects a global effort to safeguard cultural heritage. UNESCO’s World Heritage List contains some of the world’s most internationally recognized tourism assets, with the number of cultural sites increasing from 869 in 2019 to 991 in 2026.12 However, the fastest growth has occurred in UNESCO’s Intangible Cultural Heritage register, which expanded from 549 recognized elements in 2019 to 849 in 2026 across 157 countries.13 The register recognizes living traditions such as festivals, performing arts, craftsmanship and food culture, rather than physical places.
The rise in cultural resources is occurring alongside growing interest in experience-based travel. Online demand for cultural and entertainment attractions, measured through a TTDI indicator that tracks search activity related to gastronomy, heritage sites, museums, festivals, local traditions and performing arts, increased by around 15% between 2024 and 2026. For instance, more than half of travellers now prioritize food when planning trips, which helped grow the global gastronomy tourism market to $16.1 billion in 2025, up from $8.5 billion in 2021.14
Natural Resources also strengthened significantly between the 2024 and 2026 TTDI editions, increasing by 4.1%, with 96% of economies improving their scores – the broadest improvement of any pillar. The largest subregional increases were recorded in South-East Asia (+9.1%), the Balkans and Eastern Europe (+5.6%) and South Asia (+5.1%). This trend is also occurring alongside growing interest in outdoor recreation, wellness tourism and nature-based travel, creating opportunities for destinations to diversify beyond traditional cultural and urban attractions and expand tourism into more rural areas. For example, global wellness tourism expenditure reached an estimated $894 billion in 2024,15 reflecting growing demand for travel experiences linked to health, well-being and nature.
These trends create a strong opportunity for emerging and developing economies. Unlike major cultural monuments and iconic attractions, many living traditions can be developed into visitor experiences without the same level of capital-intensive infrastructure. At the same time, natural assets, from forests and coastlines to wildlife and protected areas, represent some of the sector’s strongest comparative advantages.16 Among the 30 highest-scoring economies for natural resources, 18 are emerging or developing economies, mostly located in Latin America and Asia-Pacific.
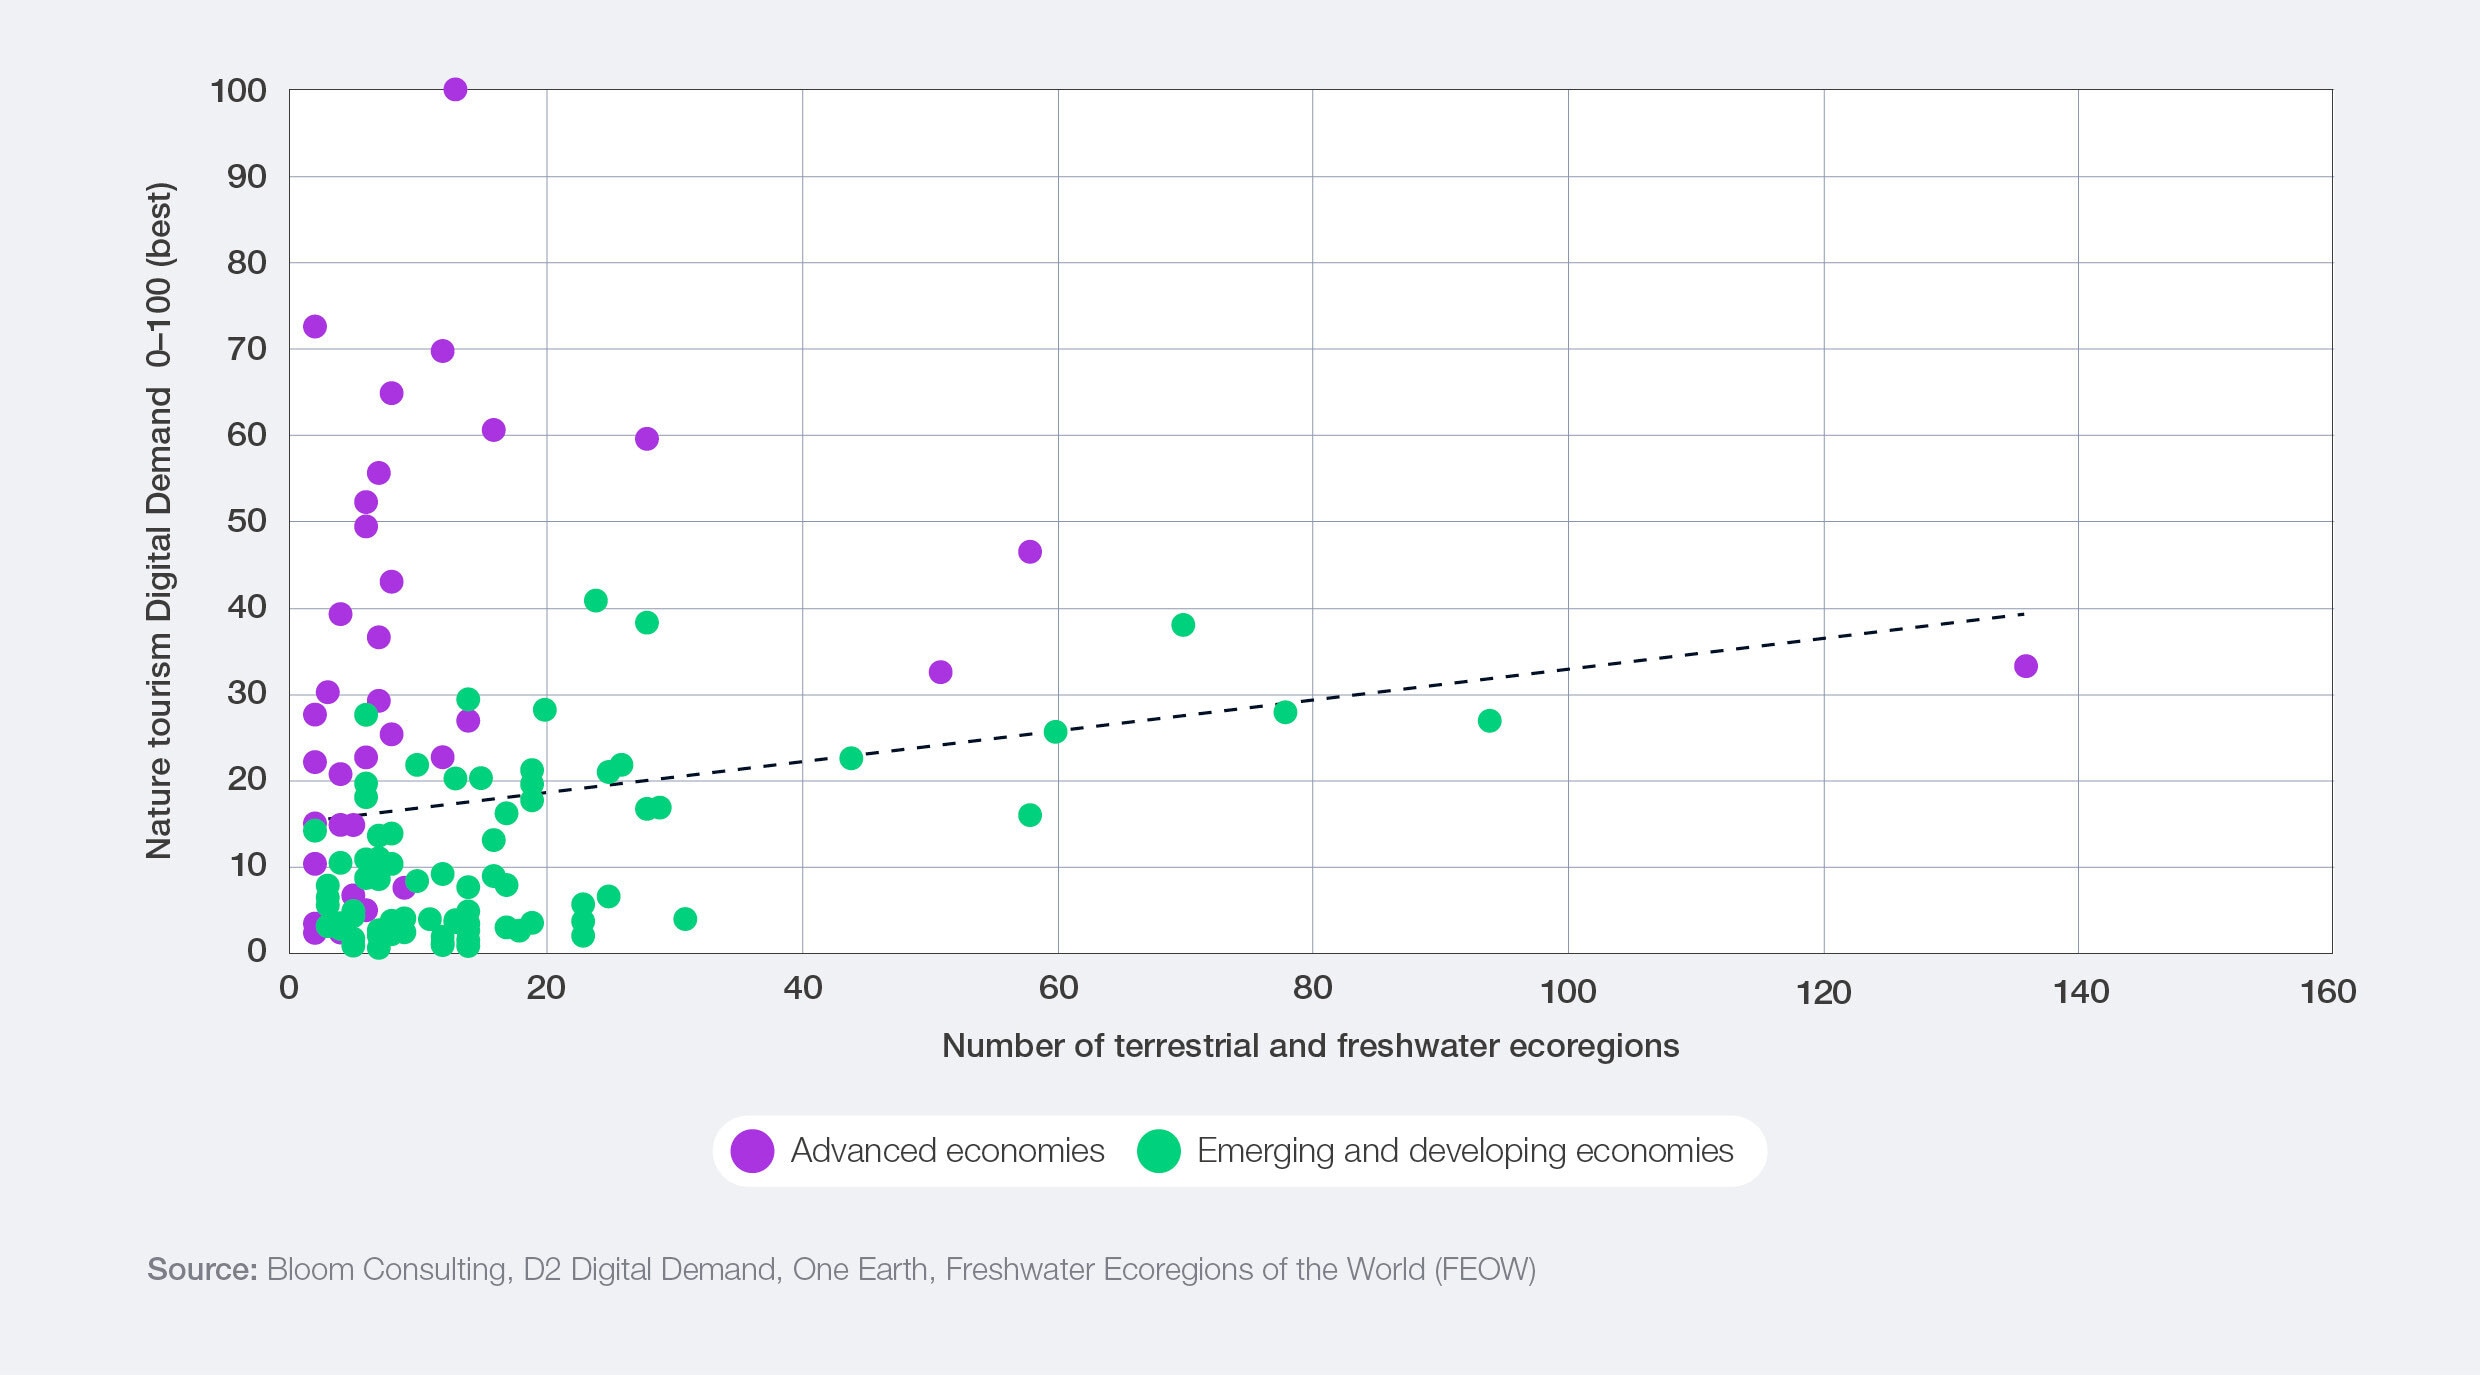
However, the possession of natural and cultural assets alone does not guarantee visitor interest. Figure 4 shows that Digital Demand for nature tourism does not always reflect a country’s natural-resource endowment. Many advanced economies dominate nature-related searches despite having fewer ecoregions (a proxy for nature diversity) than many emerging and developing economies. Converting natural and cultural assets into tourism value requires effective promotion, strong connectivity, visitor services, infrastructure and digital readiness.
Figure 4: Nature tourism Digital Demand vs. number of terrestrial and freshwater ecoregions

Non-Leisure Resources recorded a more moderate improvement (+4.6%) but remain an important part of the overall picture, with 72% of economies improving their score. The pillar captures factors that support business, conference, educational and institutional travel, including the presence of major cities, global firms, universities and research institutions.
The results coincide with a continued recovery in business travel. According to the World Travel & Tourism Council (WTTC), global T&T business spending is estimated to have reached $1.5 trillion in 2025, 4% higher than in 2024.17
Recent industry forecasts suggest that business travel demand remains resilient despite higher costs and geopolitical uncertainty, supported by continued spending on meetings, events, client engagement and other travel linked to commercial activity.18 This continued demand helps support airlines, accommodation providers and urban visitor economies in many destinations.
Taken together, these findings indicate that destinations are broadening the reasons people travel. Cultural and natural assets remain at the heart of tourism development, while the recovery of business, educational and institutional travel is strengthening other sources of demand. The strongest improvements are occurring not simply because destinations possess resources, but because they are investing more effort in protecting, promoting and connecting those resources to potential visitors.
Capacity and connectivity are improving
Another major source of improvement in the TTDI is the infrastructure that allows people to reach destinations and supports their stay once they arrive. The Tourist Services and Infrastructure and Air Transport Infrastructure pillars recorded the second- and third-largest gains of any pillar between 2024 and 2026, increasing by 9.2% and 7.2% respectively. Progress was also broadly shared, with over 90% of economies improving their scores on both pillars.
Tourist Services and Infrastructure scores were bolstered by increases in accommodation supply, sector labour productivity and investment. About 70% of economies covered by the index recorded higher T&T capital investment intensity scores (investment per employee) than in the previous TTDI edition, while global sector capital investment is estimated to have increased by 8.5% in 2025, reaching $1.1 trillion.19
Meanwhile, despite recent disruptions, progress in Air Transport Infrastructure has been underpinned by greater air route capacity and improved connectivity since 2024. This is reflected in strong growth in available domestic and international seat kilometres (+18.7%), which measures an airline’s passenger-carrying capacity, and the airport connectivity score (+8.5%), which uses the IATA Air Connectivity Index20 to measure how well an economy is integrated into the global air transport network. The biggest subregional increases were in South-East Asia (up 14.7%) and Eastern Asia- Pacific (up 13.2%), as these regions fully recovered from pandemic-era travel restrictions.
While recent gains in capacity and investment have increased the supply and capacity of T&T, it does not mean capacity constraints have disappeared. As discussed later in this section, investment in tourism-related infrastructure continues to face pressure from higher financing costs, fiscal constraints and wider economic uncertainty. Nevertheless, the latest TTDI results suggest that many destinations are making progress in expanding the infrastructure and connectivity that underpin the sector’s growth.
ICT Readiness is increasing opportunities, but digital and human capital gaps remain
ICT Readiness was one of the most improved areas between 2024 and 2026. The ICT Readiness pillar increased by 3.2%, with 91% of economies recording higher scores. Emerging and developing countries continue to close their ICT Readiness gap, increasing by 4.9% vs. 1.6% for advanced economies.
The pillar measures the foundations of a connected economy, including internet usage, broadband subscriptions, mobile network coverage, digital payments, the use of online platforms and the reliability of electricity supply. These factors shape how travellers discover destinations, book trips, pay for services and share experiences.
As highlighted in previous TTDI editions,21 digitalization shapes every stage of the travel journey, from trip planning and booking to payments and post-trip engagement. Improving ICT Readiness can help tourism businesses reach customers more effectively, while digital payments and online platforms can reduce barriers for travellers and smaller enterprises.
Advances in artificial intelligence (AI) are reinforcing these trends. Surveys suggest that many US travellers plan to use AI to research destinations, plan activities and book trips.22
Meanwhile, businesses are looking to integrate AI capabilities into everything from workflow automation and insight generation to marketing and adaptive customer journeys. The share of the world’s largest travel companies mentioning AI in their annual reports increased from just 4% in 2022 to 35% in 2024. Moreover, the share of travel industry venture capital funding going to AI-enabled offerings climbed from 10% in 2023 to 45% in the first half of 2025.23
Not all economies and tourism businesses are equally positioned to benefit from digitalization and AI. On average, emerging and developing economies score about 24% below advanced economies for ICT Readiness. Many emerging economies and small and medium-sized tourism enterprises (SMEs) continue to face barriers to digital adoption, including limited infrastructure, resources, technical expertise and digital capacity. As a result, destinations and businesses may struggle to reach travellers, access online marketplaces and adopt new technologies. Moreover, SMEs may also require support in assessing the business case for digital investment and identifying the technologies best suited to their needs. Helping smaller businesses adopt and benefit from digital tools will remain an important challenge for the sector.24
ICT Readiness is not only a question of infrastructure and connectivity, but also access to skilled workers. More than 70% of economies improved their Human Resources and Labour Market score, with strong gains in areas such as the share of labour force with advanced education (+3.6%) and perceptions of the ease of finding skilled employees (+2.1%). This suggests that access to skills is improving in many economies. However, the sector continues to face significant workforce challenges, especially in attracting and retaining workers. Many potential employees, particularly younger people, do not see the sector as an appealing long-term career. Key barriers include intense, long and unpredictable working hours, limited flexibility compared with other sectors, and perceptions of weak career progression and job security, alongside increased expectations for work–life balance and remote or hybrid work. As a result, by 2035 the T&T sector could face a shortfall of 43 million workers, 16% below required levels.25
In the World Economic Forum’s Future of Jobs Report 2025,26 most accommodation, food and leisure industry businesses identified skills gaps and difficulties attracting talent as major barriers to business transformation. The challenge is particularly acute for the T&T sector, with 55% of respondents citing difficulty attracting talent, compared with 37% across all industries.
Despite global tensions, the world remains open to visitors
The past few years have been marked by geopolitical tensions, growing concern over tourism’s impact on local communities and renewed debate about migration and border controls. Yet the TTDI results suggest that many of the conditions that enable people to travel internationally remain resilient. The Openness to T&T pillar improved by 1.8% between the 2024 and 2026 TTDI editions, reflecting gains across several measures of international mobility and visitor access.
One of the strongest improvements came from the reputation for hospitality indicator, which increased by 7.2%. Based on the TRAVELSAT Competitive Index,27 this measures how welcoming destinations are perceived to be by analysing online discussions relating to local hospitality, visitor experiences and destination quality. Unlike traditional measures of tourism performance, it focuses on the quality of the visitor experience and how local communities are perceived by visitors. The results suggest that, despite growing public debate about overtourism in some destinations, most countries remain welcoming to visitors.
However, progress on visa policies has been more uneven. Based on the latest available data included in the TTDI, only around one-third of TTDI-ranked economies reduced visa requirements between 2024 and 2026, with much of the improvement concentrated in Asia-Pacific and the Middle East and North Africa. European and North American economies continue to maintain some of the highest visa requirements on average, indicating that some of the most advanced T&T economies retain higher formal barriers to visitors outside their region.
The Safety and Security (+2.1%) and Health and Hygiene (1.4%) pillars also improved over the period. This suggests that many destinations continue to strengthen the conditions that support safe and reliable travel.
Government roles are evolving
Index results also point to an evolving role for government in tourism development. While average scores for the Prioritization of T&T pillar improved by 1.7% between 2024 and 2026, they remain below 2019 levels. However, the picture is more nuanced than the headline suggests. Government spending on tourism as a share of total public spending has risen by 7.6% since 2019, reflecting increased public-sector support for the sector in many economies.
Much of the pillar’s long-term decline is driven by the Country Brand Strategy indicator, which remains below 2019 levels despite improving by 1% since 2024. The indicator measures how closely national tourism promotion aligns with traveller search behaviour. According to Bloom Consulting, recent changes partly reflect a broader shift in how destinations are discovered online, including the growing role of AI-driven search and recommendation systems. Rather than signalling weaker tourism promotion, the results may indicate a period of adaptation as tourism organizations adjust their content and branding strategies to a rapidly evolving digital environment.
3.2 Conditions are stronger, but constraints are growing
While TTDI results point to a strengthening of the conditions supporting tourism development, they also highlight growing constraints. As visitor demand has continued to grow, affordability pressures have intensified, investment has struggled to keep pace with demand, and sustainability challenges have become more complex.
Pricing and economic uncertainty pressures continue to build
In general, the cost of travelling to, staying in and operating within many destinations has continued to rise. Price Competitiveness was one of the lowest-performing pillars in the TTDI between 2024 and 2026, with 75% of ranked economies recording lower scores, leading to the global average declining by 3.1%.
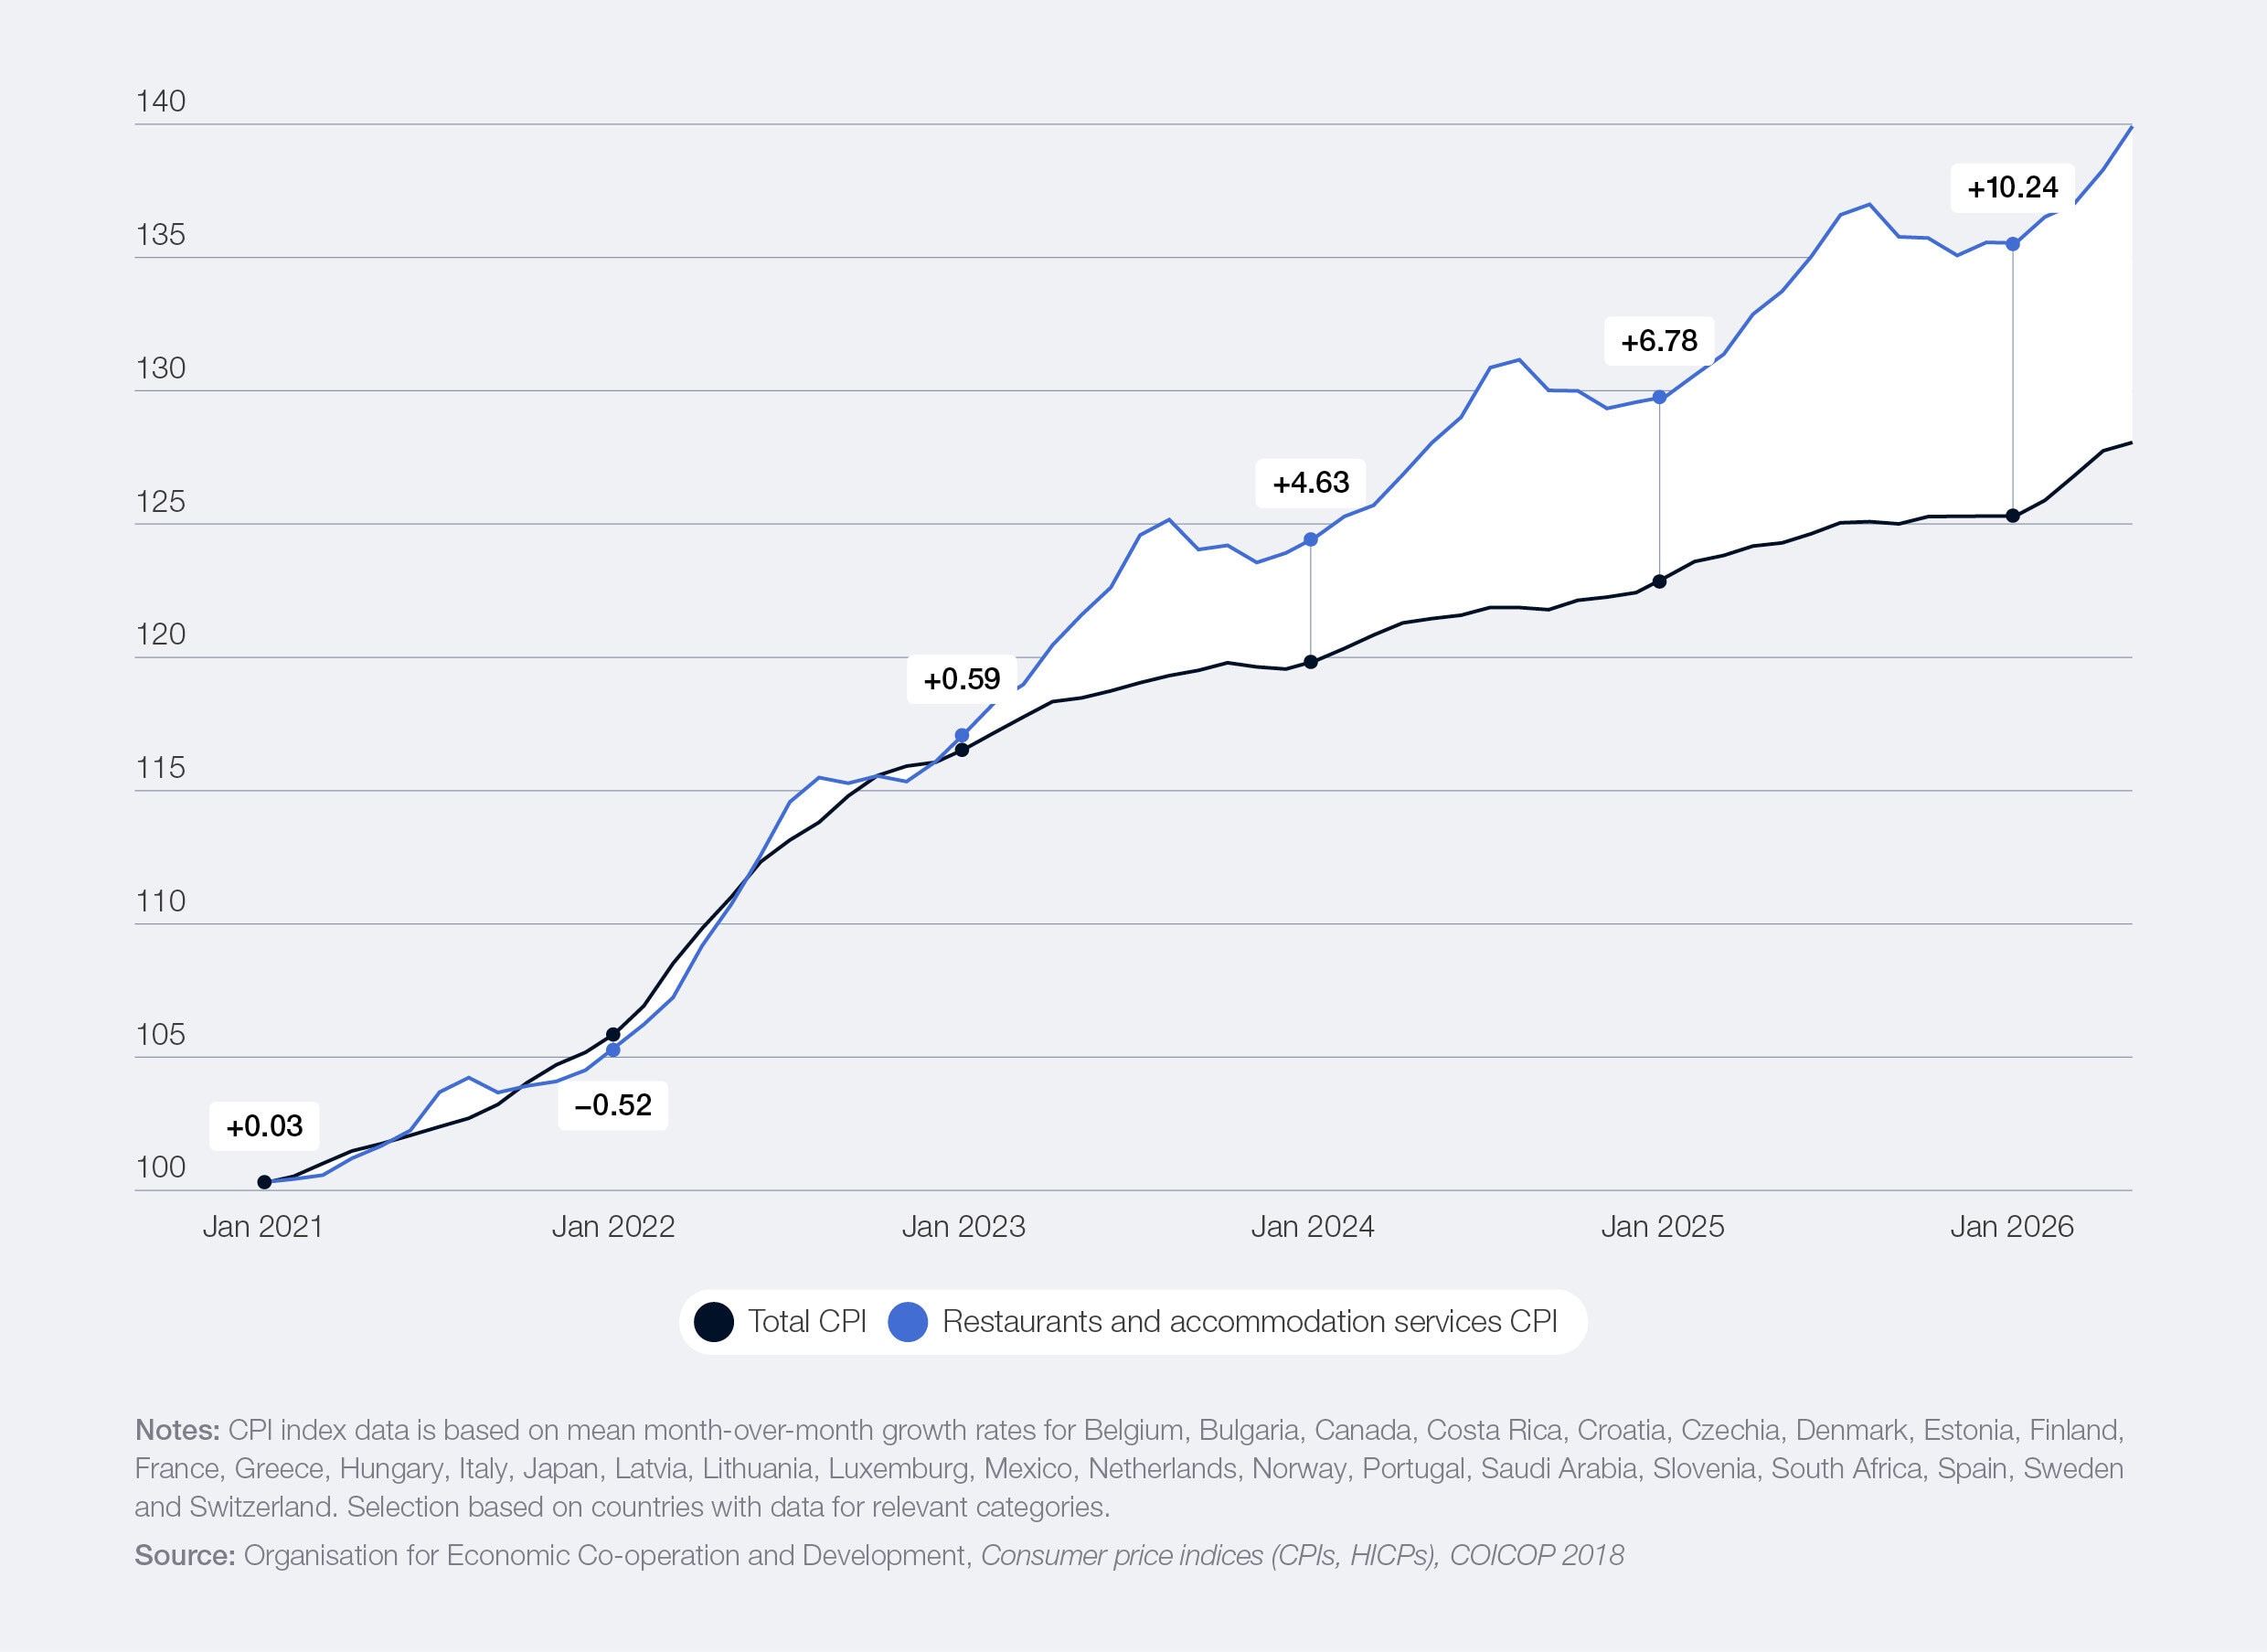
In many countries, T&T-related prices have outpaced overall inflation (see Figure 5). While the drivers vary across economies, higher labour, food and energy costs probably contributed to this divergence, with the sector being particularly exposed to volatile fuel and transportation prices. Since 2024, prices for gasoline (petrol) have increased in about 65% of ranked economies, with recent price shocks linked to the ongoing conflict in the Middle East likely to cause further pressure. Strong travel demand in recent years, combined with capacity constraints in some destinations, has also allowed businesses to pass a greater share of these cost increases to consumers. For instance, mid-class and above hotel room prices increased by an average of 6% among ranked economies.
Figure 5: Restaurants and accommodation vs. total consumer price index (CPI), select countries average

These pressures are changing how value is understood. Lower prices still matter, but travellers are weighing cost against accessibility, quality, reliability and the overall experience. For highercost destinations, this increases the pressure to justify prices through stronger infrastructure, service quality and destination management. For lower-cost destinations, it can create an opening if affordability is matched by improving tourism development conditions.
This opportunity can be particularly strong for destinations located close to more expensive tourism markets. According to the TTDI, the Balkans and Eastern Europe are significantly more price competitive than Western, Southern and Northern Europe. Combined with dense intra- European transport networks, this cost advantage can help attract travellers seeking more affordable alternatives within the region.
The TTDI also points to pressure on investment. The Business Environment pillar has remained largely stagnant since 2024, with fewer than half of ranked economies improving their scores. Across many economies, indicators related to policy stability, access to finance and the investment climate have remained stagnant or have deteriorated. According to the World Economic Forum’s Global Risks Report 2026,28 geoeconomic confrontation (sanctions, tariffs, investment screening), state-based armed conflict and economic downturn are among the top 10 risks facing the world. Against this backdrop, T&T capital investment has increased in recent years but remains below 2019 levels.
WTTC analysis of G20 economies finds that T&T capital investment has lagged behind demand since 2022. This investment gap is expected to persist until 2033.29 This matters because tourism depends on long-lived, capital-intensive assets. Hotels, airports, attractions and transport infrastructures require high upfront investment and long planning horizons. Higher interest rates, fiscal pressures, trade tensions and geopolitical uncertainty can slow the investment needed to expand capacity, improve productivity and maintain quality. If investment fails to keep pace with demand, capacity pressures, costs and localized overcrowding can intensify.
The effects are visible in other parts of the TTDI. Ground and Port Infrastructure pillar scores have remained stagnant, suggesting that funding for capital-intensive assets such as roads and railways has struggled to keep pace with rising tourism demand.
The findings highlight a growing tension. Rising prices reflect strong demand and higher operating costs, but they also make travel less affordable and increase pressure on businesses and destinations. Economic uncertainty also makes it harder to invest in the assets needed to expand capacity and ease those pressures. Destinations must not only manage higher costs but also ensure that investment, infrastructure and service quality keep pace with the expectations of travellers and communities.
Sustainability pressures are becoming more complex
The TTDI highlights the complexity of the sustainability challenges facing the sector. As travel demand continues to grow, destinations face growing pressure to manage visitor flows, reduce environmental impacts, strengthen the sustainability of tourism supply chains and ensure that tourism creates lasting benefits for local communities. Progress is evident in some areas, but balancing these objectives is becoming more complex.
Benefiting from the energy transition, but sustainability challenges remain
Despite continued growth in T&T, energy sustainability improved between the 2024 and 2026 editions. Most ranked economies reduced their T&T-related greenhouse gas (GHG) emissions and energy intensity, while the TTDI found that the share of low-carbon energy increased from 5.7% on average in 2018 to nearly 7.0% in 2024. Many of these gains reflect broader progress in the global energy transition. The World Economic Forum’s Energy Transition Index 202630 highlights continued advances in energy system efficiency, electrification and renewable energy deployment, including a record $2.3 trillion invested in clean energy worldwide. These developments are benefitting the T&T sector, especially segments that rely heavily on electricity, such as hotels and other accommodation providers.
These gains are encouraging, but they should not be mistaken for a broader sustainability breakthrough. Continued growth in T&T, particularly in less energy-sustainable emerging economies and Asia-Pacific, is likely to increase energy demand and emissions unless improvements in energy efficiency and clean energy deployment accelerate. Moreover, the growth of hard-to-abate sectors such as aviation and other transport services will make decarbonization more difficult.
In addition, air quality, water stress, biodiversity loss and resource pressures continue to challenge many destinations. Tourism demand is also growing at a time when climate risks are becoming more visible, increasing the importance of adaptation and resilience measures across the sector. According to the World Economic Forum’s Global Risks Report 2026,31 environmental risks such as extreme weather events, biodiversity loss and pollution account for half of the world’s top 10 risks over the next decade. Extreme weather events can affect tourism both directly – through road and airport closures, infrastructure damage, shutdown of outdoor attractions or cancellation of festivals and events – and indirectly, by harming the reputation of destinations and deterring future visitors. In Canada, for example, unprecedented wildfires near Jasper, Alberta, during the peak 2024 tourist season caused an estimated CAN$4.5 million ($3.25 million) in lost tourism revenue per day, while critical infrastructure damage curtailed accommodation capacity by roughly 25% even a year later.32
Sustaining recent progress will also require continued investment in energy systems, transport infrastructure, resource efficiency and environmental management. The energy transition is creating opportunities for the sector to reduce its environmental footprint, but current progress is unlikely to be sufficient without faster advances in decarbonization, adaptation and resource management.
Managing growth and visitor pressure
T&T Demand Sustainability improved modestly between 2024 and 2026. High scores show countries managing a steady inflow while managing growth effectively. However, scores remain below 2019 levels, highlighting the difficulty of managing crowding, seasonality and visitor flows as tourism activity expands. Managing growth remains one of the most important enablers to unlocking the potential of the sector.
Many destinations naturally perform better on measures of crowding and seasonality when visitor numbers are low. As demand recovers, pressures associated with concentrated visitor flows, overcrowding and infrastructure strain often re-emerge. In that sense, lower T&T Demand Sustainability scores do not necessarily indicate policy failure. Rather, they reflect the challenge of maintaining balanced tourism growth as visitor volumes increase.
Europe recorded the lowest T&T Demand Sustainability scores of any region, underperforming the global pillar average by nearly 12%. Anti-tourism protests in Barcelona and the Balearic and Canary Islands in Spain in 2024 and 202533 illustrate the growing debate about how tourism growth should be managed in high-demand destinations.
Recent OECD analysis34 highlights growing efforts to better manage visitor flows and diversify tourism activity to improve outcomes for communities and the environment. These efforts focus on spreading tourism demand more evenly across destinations and throughout the year, helping to ease pressure on overcrowded locations while supporting a more balanced distribution of tourism benefits.
Success also depends on investment in housing, transport, utilities and public services, alongside stronger coordination among governments, businesses and local communities. As tourism continues to grow, the challenge will increasingly be to ensure that visitor activity supports local quality of life while sustaining economic benefits. This places growing importance on measuring tourism’s economic, social and environmental impacts in a more integrated way, including through frameworks such as the UN Statistical Framework for Measuring the Sustainability of Tourism.35
Turning visitor growth into wider benefits
The weakest sustainability-related result comes from the T&T Socioeconomic Impact pillar, which declined by 3.5% between the 2024 and 2026 TTDI editions and improved in only around 17% of economies.
The results highlight an important reality: higher visitor numbers do not automatically translate into stronger socioeconomic outcomes. While tourism activity has continued to recover in many destinations, improvements in indicators such as employment and GDP multipliers, and the availability of higher-wage tourism jobs have generally been more modest.
Part of the challenge is that tourism’s wider contribution depends on how effectively tourism activity is connected to the local economy. Destinations differ in the extent to which visitor spending supports local businesses and supporting industries, in how successfully tourism generates quality employment, and in the extent to which tourism generates tax revenues that can support public services and wider community development. While the pillar does not directly measure factors such as local sourcing or the retention of tourism spending within a destination, these can influence how widely tourism benefits are distributed across businesses, workers and communities.
Where tourism employment is highly seasonal or concentrated in lower-value activities, increases in visitor numbers may not translate into improvements in livelihoods or job quality. At the same time, destinations with stronger workforce capabilities and deeper connections between tourism and other sectors may be better positioned to translate tourism growth into wider economic benefits.
Growing visitor numbers remains important, but creating greater value from those visitors – and ensuring that this value is more widely shared – will increasingly define successful tourism development. As tourism recovers and expands, many destinations are increasingly focusing on how benefits are distributed among people, businesses and communities, rather than relying solely on visitor growth and spending as indicators of success. This places greater emphasis on destination management, local business participation, workforce development and policies that strengthen tourism’s wider contribution. It also highlights the importance of shared measures of success that reflect community, economic and social outcomes rather than visitor volumes alone.36
The findings suggest that destinations face a question of quality rather than quantity.
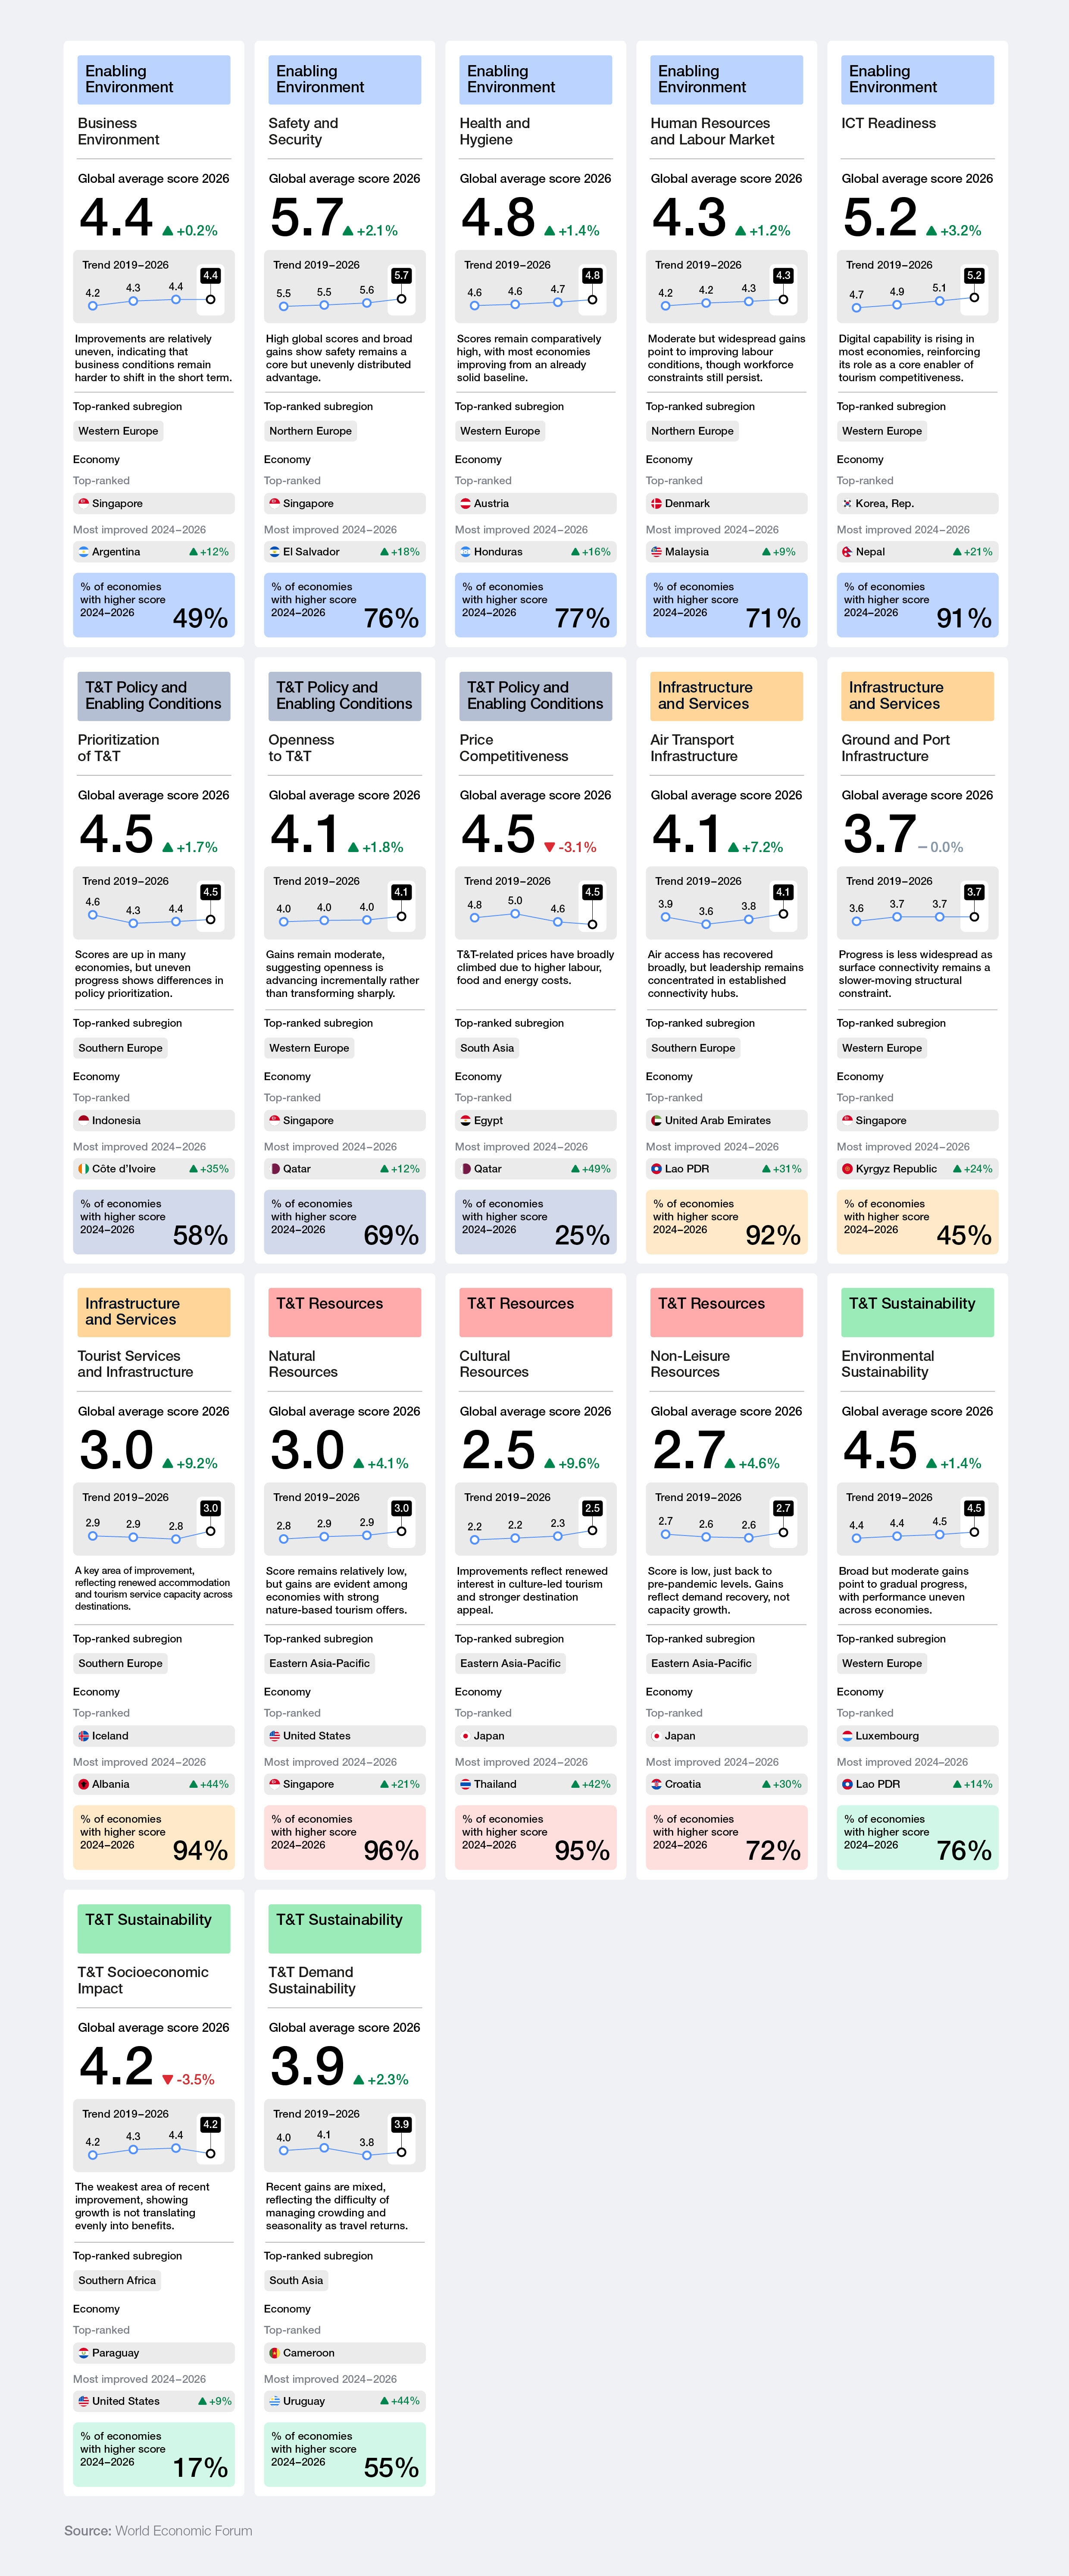
Figure 6: TTDI pillar performance (score out of 7), leaders and recent improvement, 2026