Travel & Tourism Development Index 2026


4. Economy and regional performance
T&T development improved in most economies in the TTDI results, but progress remains uneven.
Section takeaways
- Tourism development conditions improved in almost every economy: Between 2024 and 2026, 92% of economies improved their TTDI score, reflecting broad-based progress in both advanced and developing tourism markets. Gains were recorded across every region and income group.
- Advanced economies continue to set the pace: High-income economies account for 19 of the top 20 TTDI performers, combining world-class tourism infrastructure, strong connectivity, major commercial centres and favourable enabling conditions. Japan leads the rankings, while European economies hold six of the top 10 positions.
- Asia-Pacific and emerging tourism economies are gaining ground: The 10 largest emerging tourism economies have improved their TTDI scores more than twice as fast as the top 20 since 2019. Asia-Pacific is driving much of this momentum, accounting for seven of the 10 fastest-improving performers, while Albania was the most improved economy overall between 2024 and 2026.
Many destinations are strengthening their tourism assets and connectivity, but those with deeper infrastructure, services and supporting systems continue to hold an advantage.
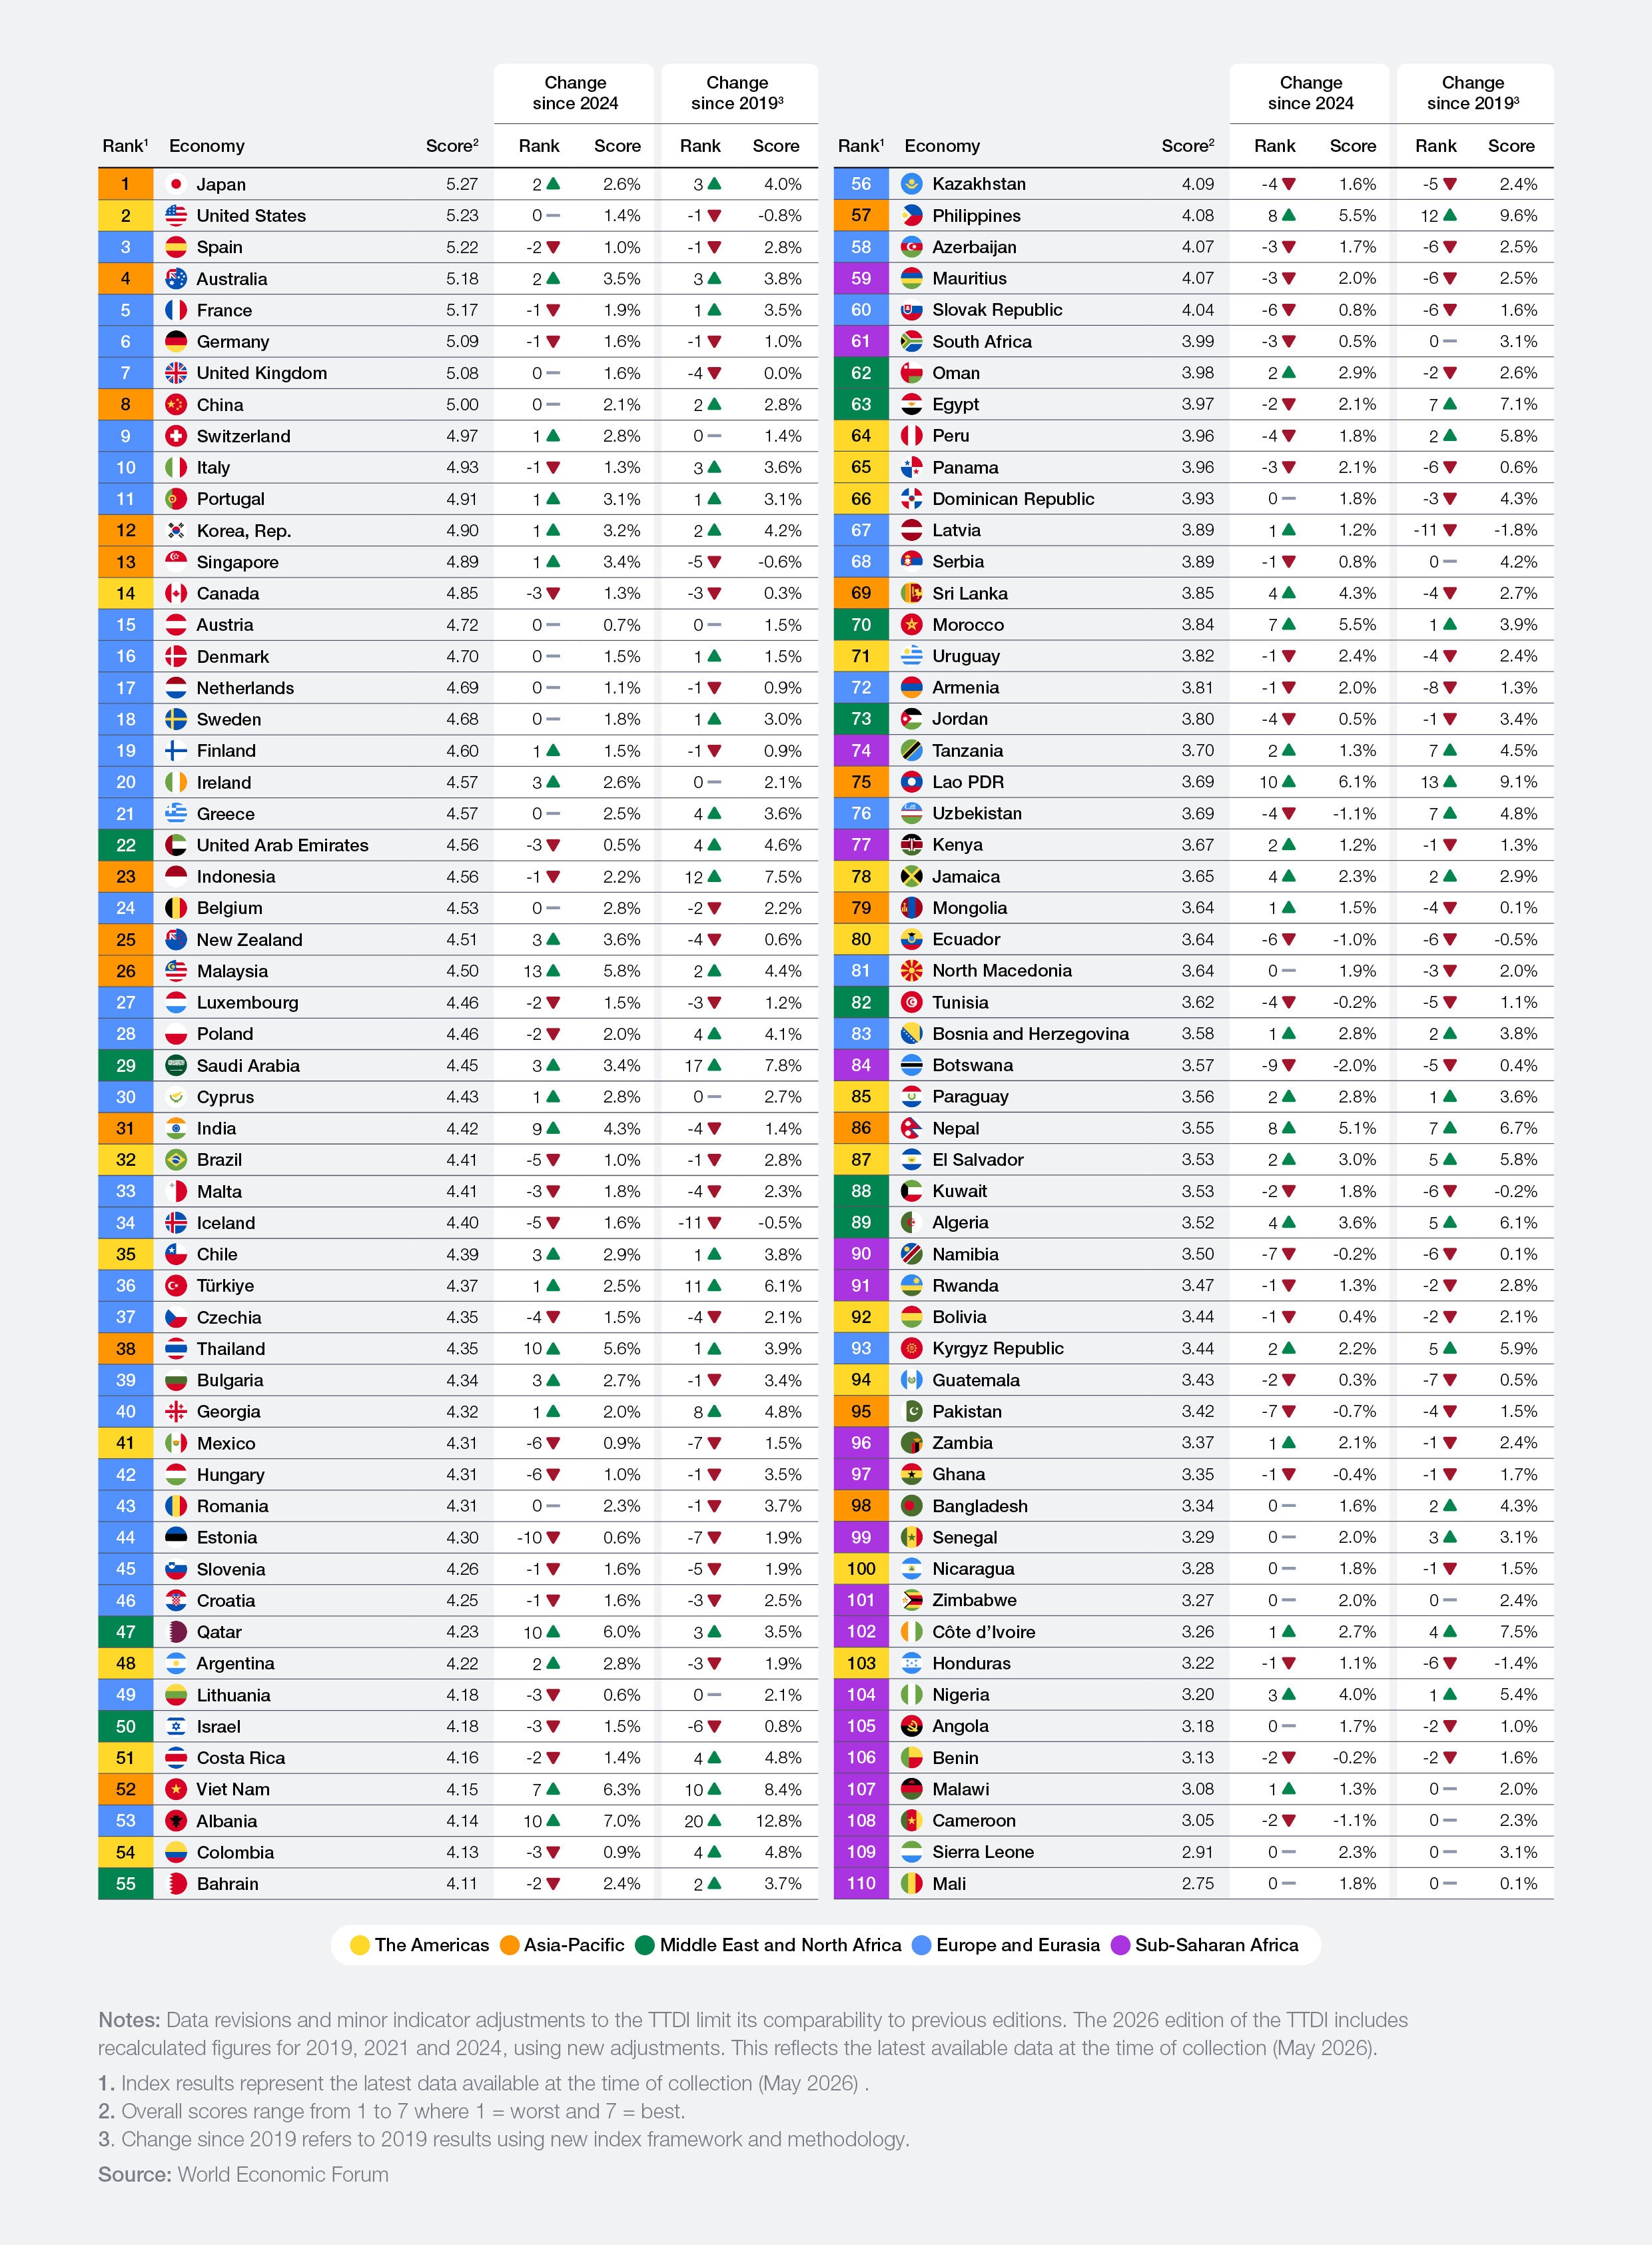
Figure 7: Travel & Tourism Development Index 2026 overall rankings

4.1 Rankings overview
The 2026 TTDI results show that performance has strengthened across almost all economies in the index, but that the pace of improvement varies considerably.
Across all 110 economies, 101 – or 92% – improved their score between 2024 and 2026, while every economy in the top 75 recorded gains. The same 10 economies occupy the top 10 positions as in 2024, although their ranking order has changed. They are Japan, the United States, Spain, Australia, France, Germany, the United Kingdom, China, Switzerland and Italy. With the exception of Australia and Switzerland, all are also among the world’s 10 largest travel and tourism economies.37 Japan and Australia also improved at a slightly faster rate than the overall index. This partly reflects stronger demand and greater capacity in Asia-Pacific as the region continued to recover from its delayed post-pandemic reopening. As a result, Asia-Pacific was the most improved region, with its average TTDI score increasing by 3.6% between 2024 and 2026.
The region’s developing economies have particularly benefitted from this growth, with seven out of the 10 most improved economies coming from developing countries in South-East and South Asia, including Lao PDR (+6.1%), Malaysia (+5.8%) and Thailand (+5.6%). However, Albania stands out as the strongest overall improver between 2024 and 2026, increasing its score by 7.0%. Its gains were driven by improvements in tourist services and infrastructure, air transport, and ground and port infrastructure – the foundations of access and service capacity that help destinations convert growing visitor demand into tourism growth.
More broadly, while the high-income economies continue to dominate the top of the index, some of the strongest momentum is occurring among a group of large emerging tourism economies that are steadily closing the gap with the leaders. The following sections explore what distinguishes the highest-ranked economies, where this momentum is concentrated and what still separates the fastest-rising destinations from the world’s leading tourism economies.
4.2 Top 20 performance
The highest-ranked economies in the TTDI continue to be distinguished by the depth and scale of the assets that support T&T. Most are advanced economies with long-established tourism sectors, extensive visitor infrastructure and strong international connectivity, although the group also includes major emerging tourism powers such as China.
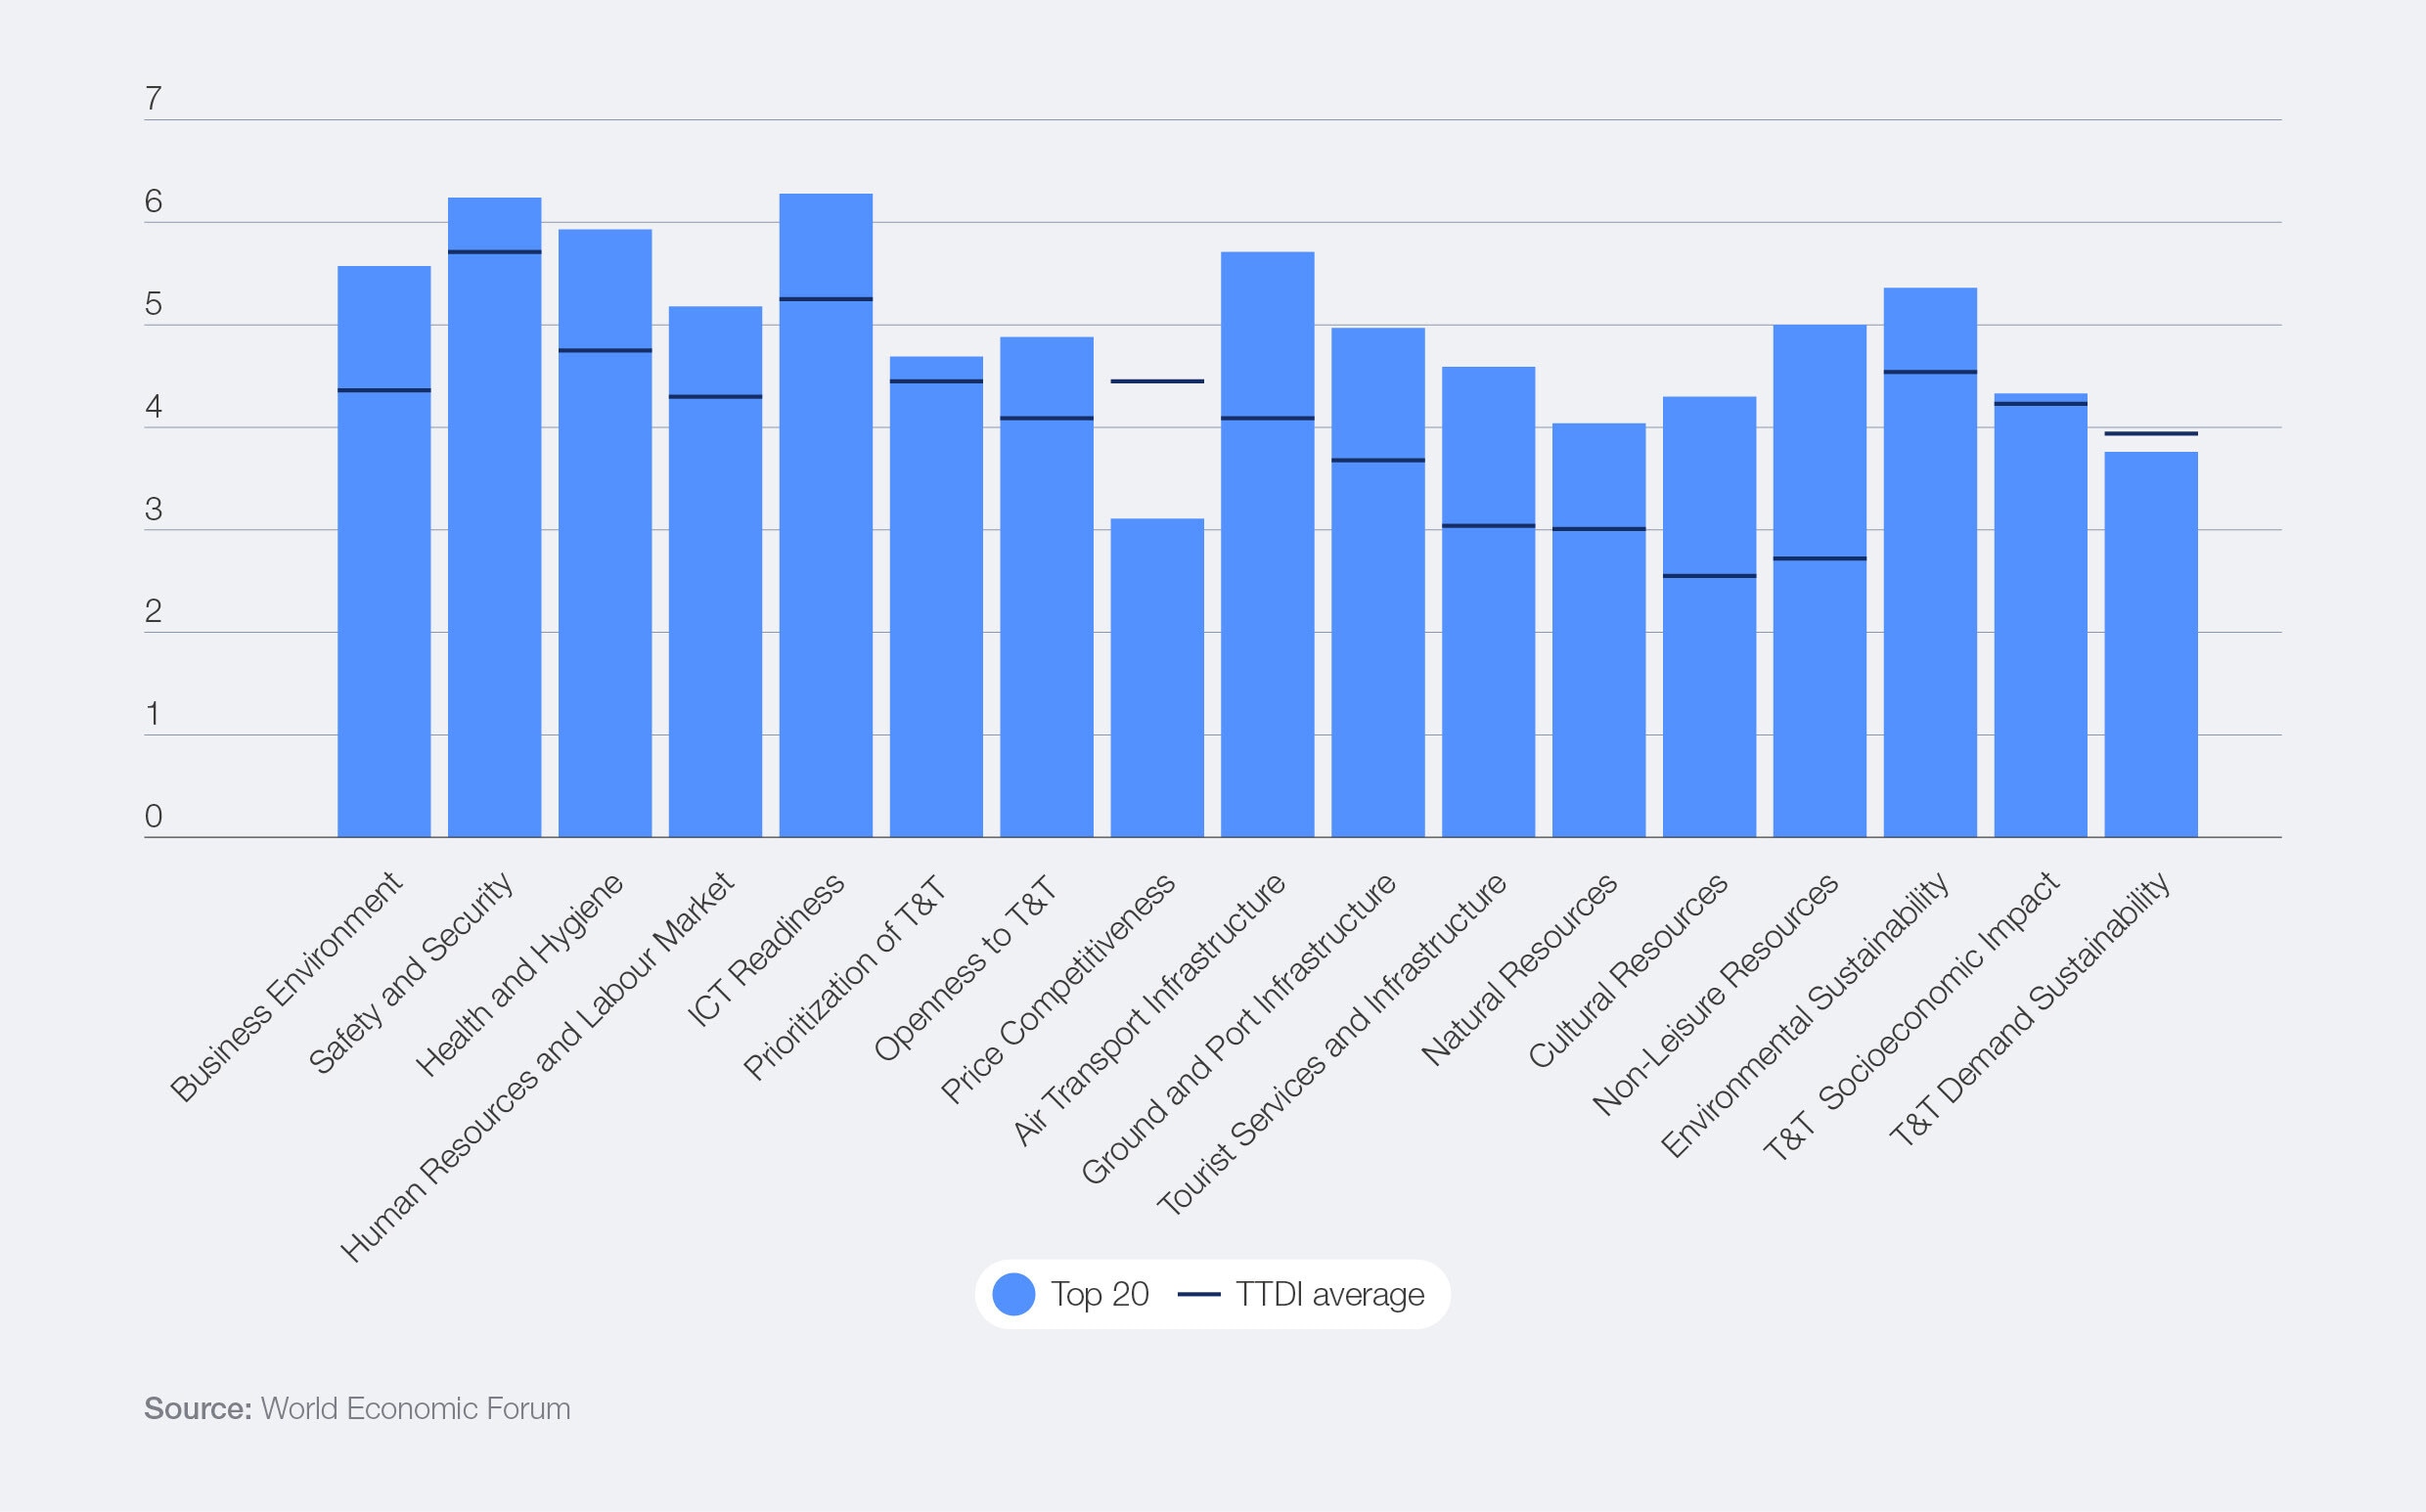
Compared with the other economies in the index, the top 20’s largest advantages are concentrated in Non-Leisure and Cultural Resources, Ground and Port Infrastructure, Air Transport Infrastructure and Tourism Services and Infrastructure (see Figure 8). These economies tend to combine large business hubs, internationally recognized attractions, extensive transport networks and the accommodation and visitor services needed to support high volumes of leisure and business travel. They also benefit from stronger Health and Hygiene, Safety and Security, ICT Readiness and Business Environment conditions.
Domestic and regional travel flows help reinforce these advantages. Domestic tourism accounted for almost three-quarters of total T&T spending in 2025.38 Countries with large domestic markets, such as the United States, benefit from a stable source of demand that helps sustain tourism infrastructure and services even when international arrivals fluctuate.
Domestic travel also enhances resilience by reducing reliance on international source markets, smoothing seasonal demand and supporting tourism activity beyond major visitor hotspots. In Europe, dense networks of short-haul travel provide a similar source of stability, helping sustain visitor volumes, connectivity and accommodation capacity.
Non-leisure travel can provide a similar stabilizing effect. Business travel, meetings and events often generate year-round demand, support higher visitor spending and help sustain tourism activity outside peak leisure seasons.
The leaders do not dominate every pillar. The top 20 perform significantly worse than the rest of the world on Price Competitiveness and slightly below average on T&T Demand Sustainability. This reflects a common pattern among mature tourism economies: success often brings higher costs and greater pressure on popular destinations. Many of the European economies also score lower for T&T Socioeconomic Impact, reflecting tourism intensity and the pressures associated with high visitor volumes. At the same time, they tend to lead the world on Environmental Sustainability, suggesting a greater capacity to manage environmental pressures, protect the assets on which tourism depends and strengthen their appeal to environmentally conscious travellers.
Figure 8: Top 20 TTDI scorers versus the index average by TTDI pillar, 2026

4.3 Major emerging economies are gaining ground
While advanced economies continue to dominate the top of the index, some of the strongest momentum is occurring elsewhere. This section examines China, India, Indonesia, Malaysia, Thailand, Viet Nam, the Philippines, Türkiye, Mexico and Brazil – the 10 largest non-high-income T&T economies by direct T&T GDP.
Together, these economies account for more than 28% of global direct travel and tourism GDP, with their share projected to rise to 35% by 2035.39 They therefore represent one of the most important sources of future tourism growth.
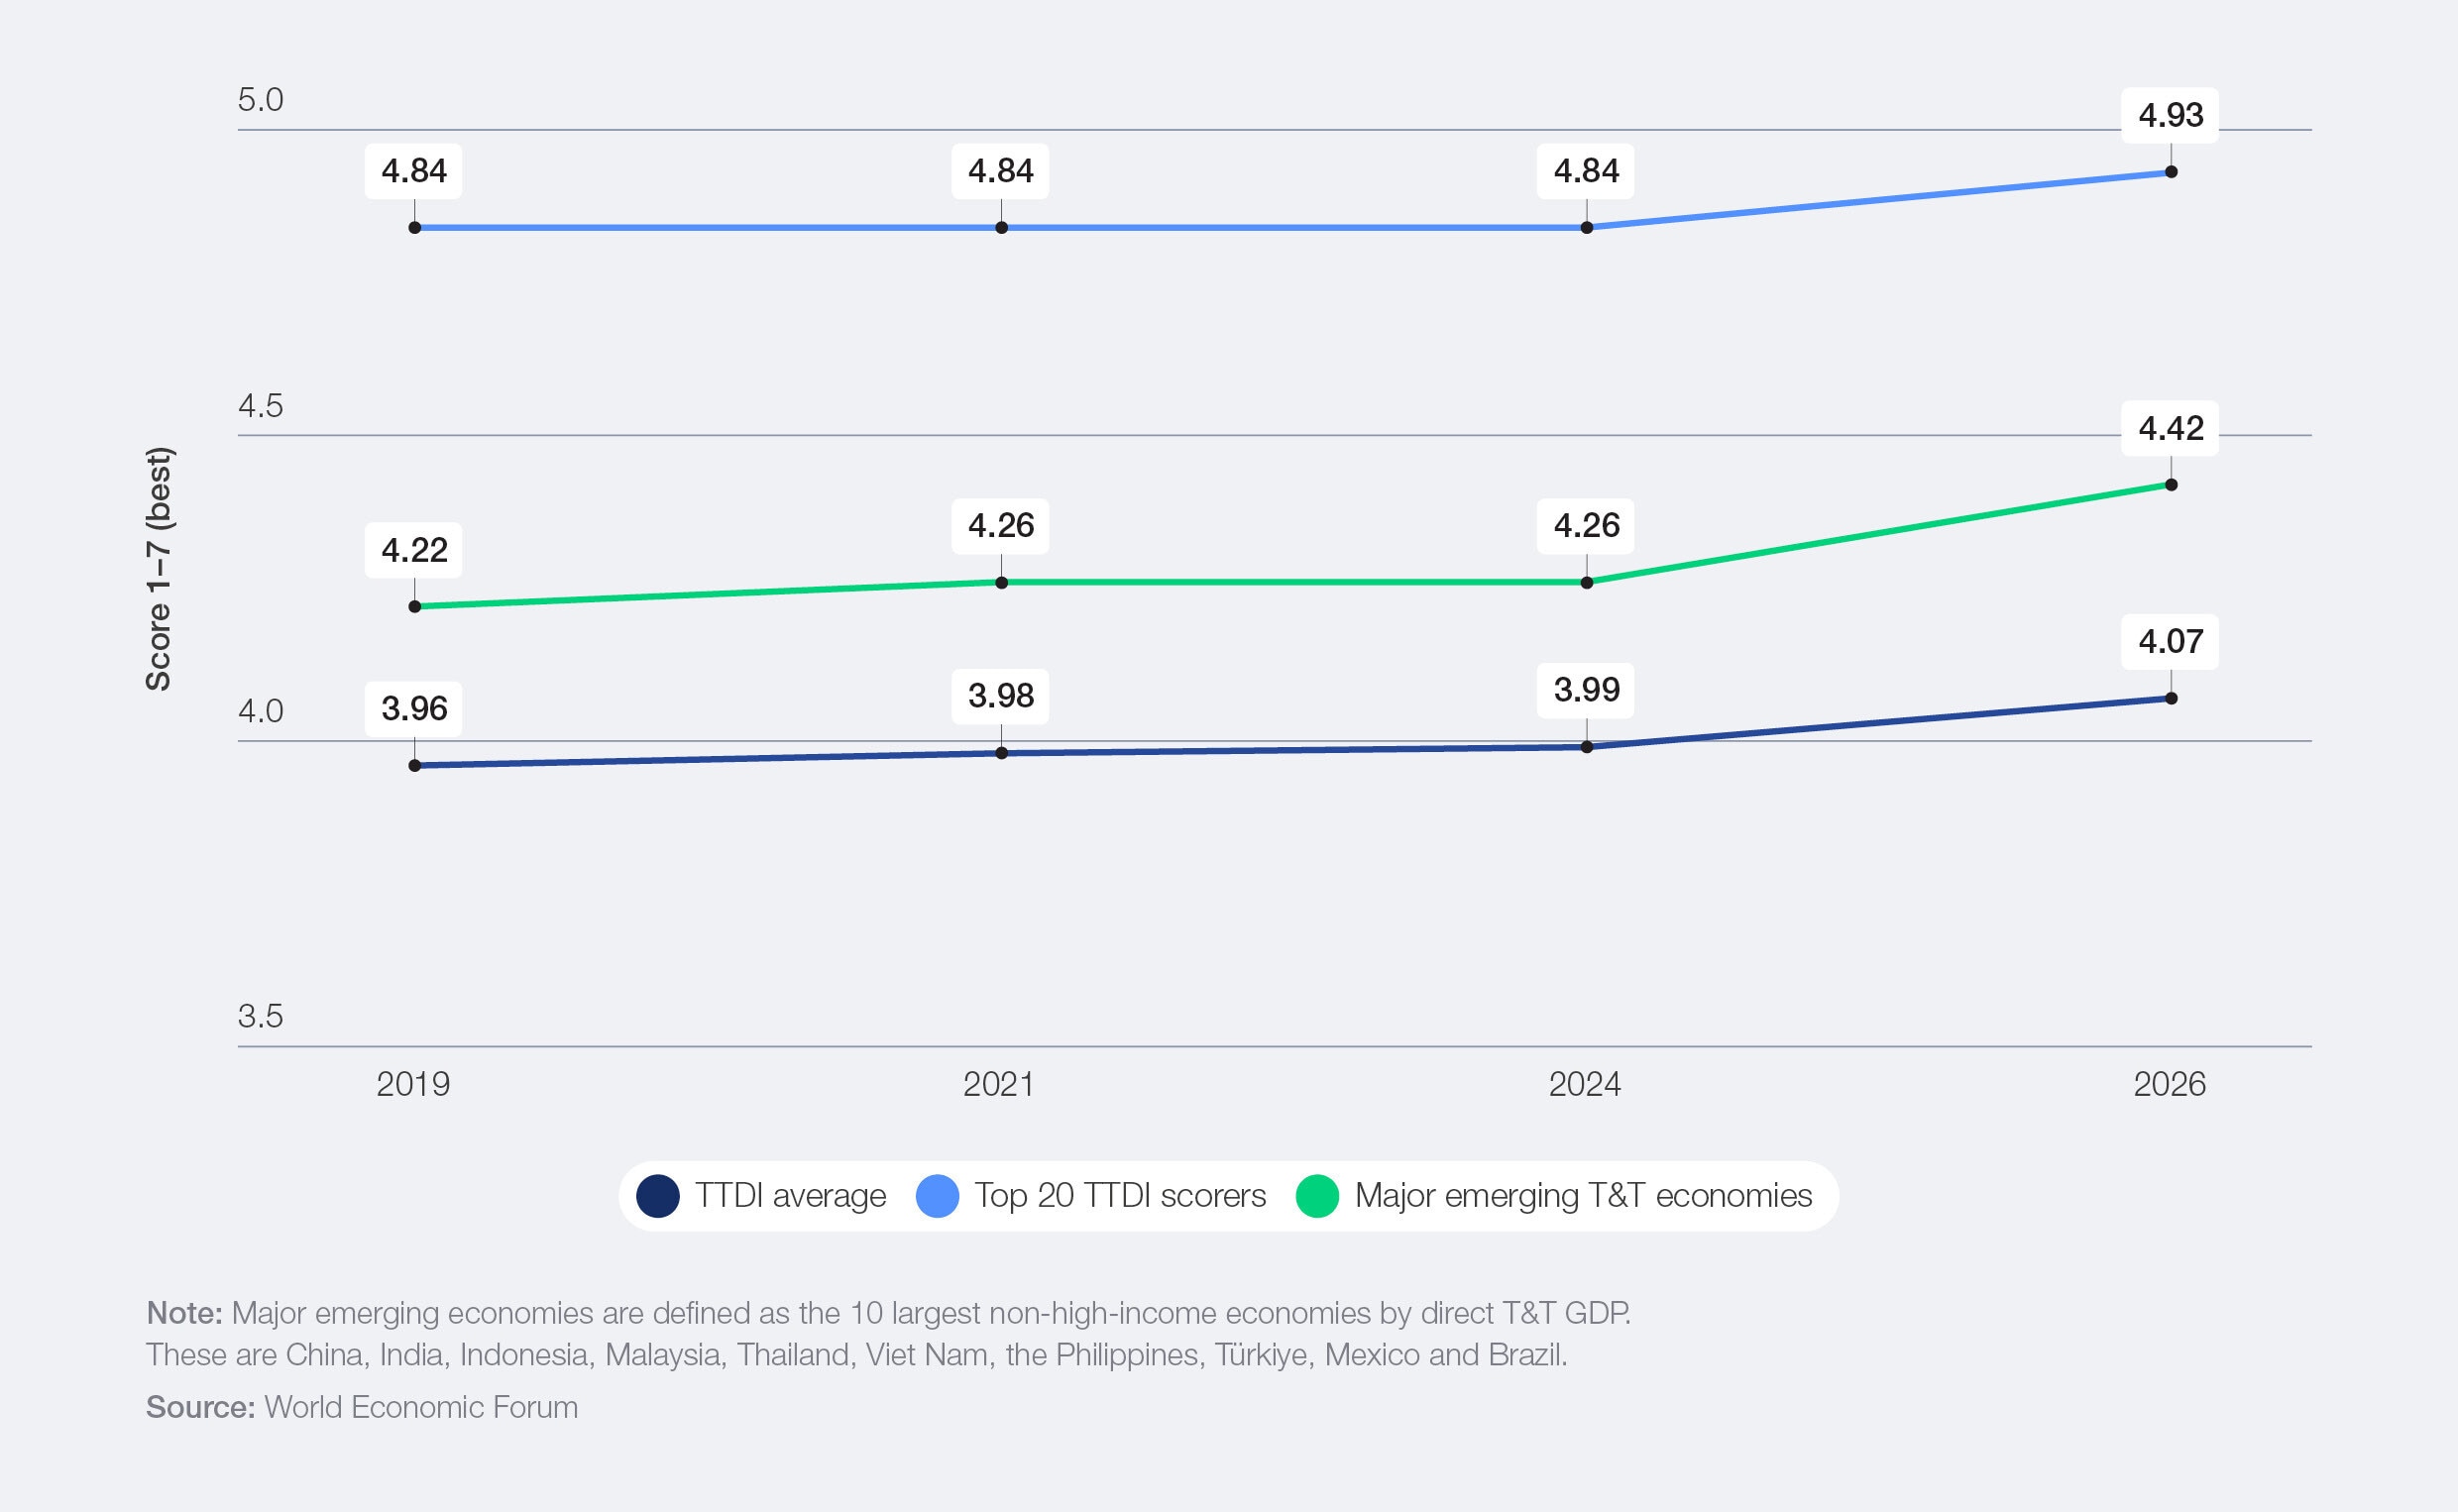
Their recent progress has also outpaced the wider index (see Figure 9). Looking back to 2019, these economies increased their average TTDI score by 4.7%, compared with 2.9% and 1.9% for the overall index and the top 20, respectively. Between 2024 and 2026 alone, these economies improved at a faster rate than the remaining 100 economies on 15 of the 17 TTDI pillars.
Figure 9: TTDI score: 10 major emerging tourism economies, top 20 TTDI scorers and all economies, 2019–2026

The improvement of major emerging tourism economies has been widespread. The more important question now is what continues to separate them from the world’s tourism leaders.
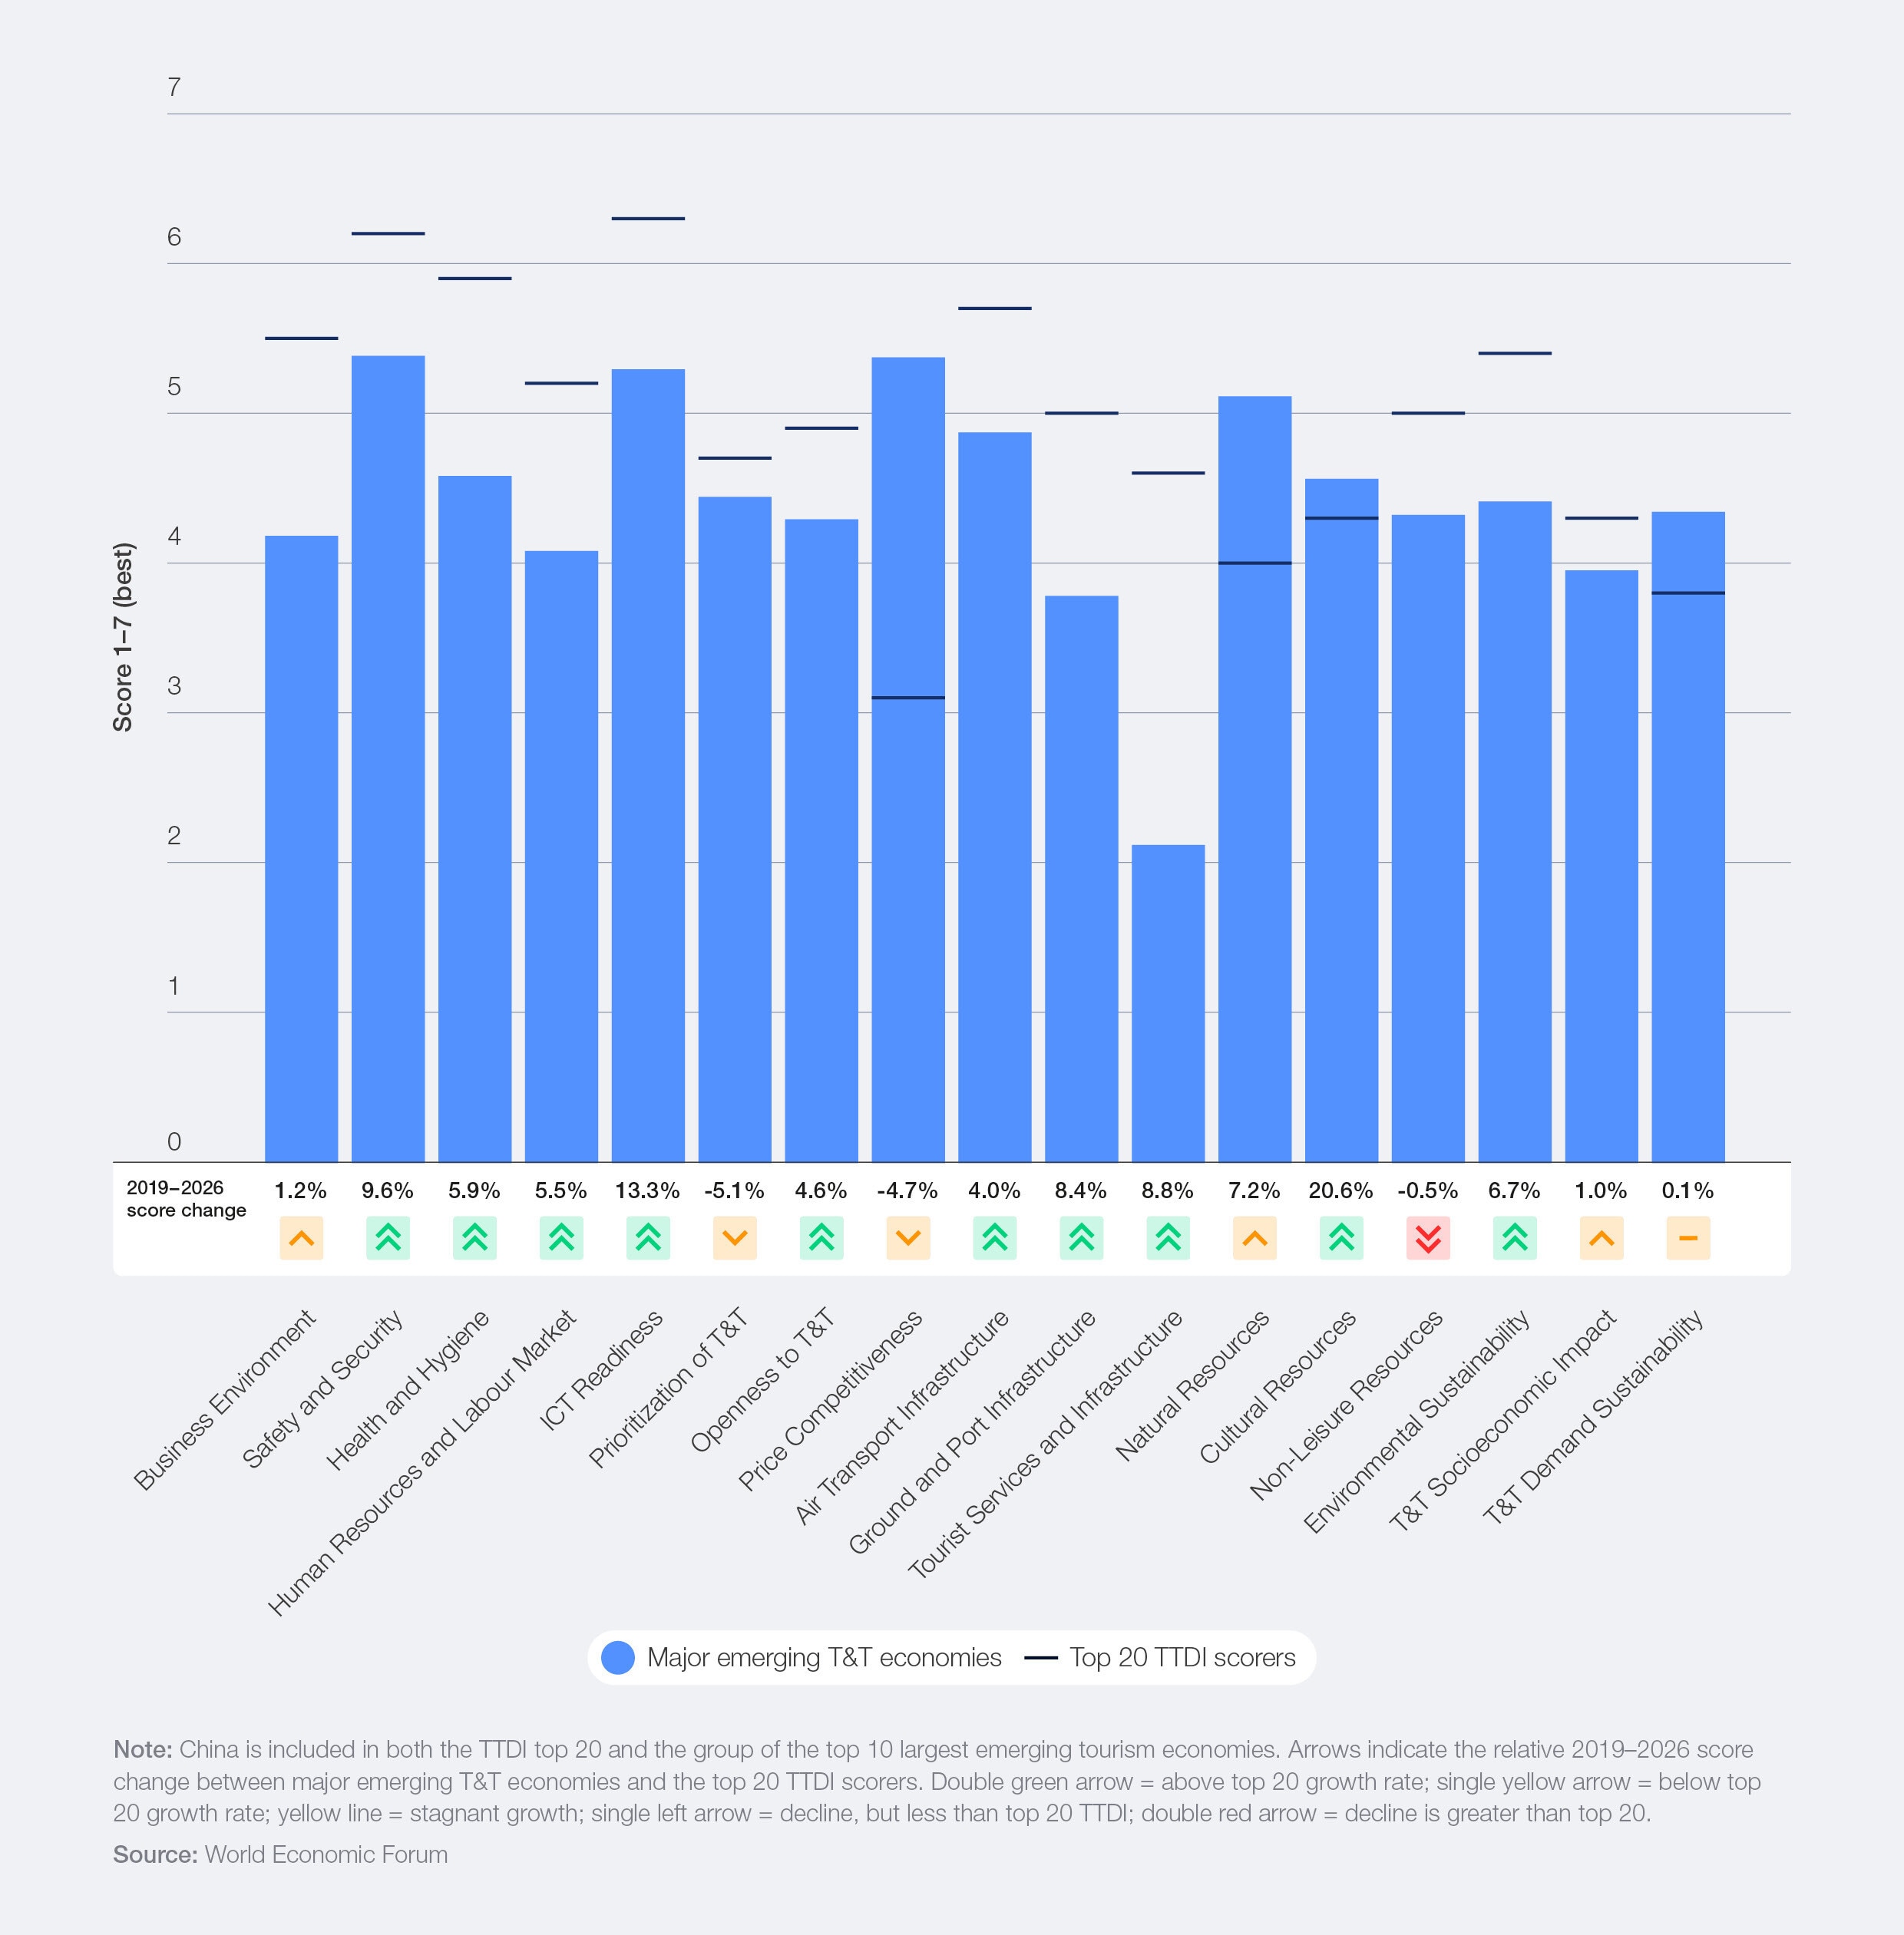
As a group, the 10 major emerging tourism economies outperform the top 20 on Price Competitiveness, Natural Resources, T&T Demand Sustainability and Cultural Resources (Figure 10). Their tourism appeal is underpinned by a strong combination of natural assets, cultural heritage and competitive pricing. For instance, Brazil, China, India and Mexico account for over 17% of UNESCO World Heritage natural sites among TTDI-ranked economies, while China, India and Mexico also rank among the top 10 for the number of World Heritage cultural sites.
Since 2019, they have also outperformed the top 20 on 12 pillars, expanding their lead in Cultural Resources while closing gaps in ICT Readiness, Safety and Security and Air Transport Infrastructure.
Nonetheless, important gaps remain. Tourist Services and Infrastructure represents by far the largest difference between these economies and the top 20, underscoring the need for greater investment in accommodation, visitor services and supporting infrastructure. Below-average scores for the Business Environment and Human Resources and Labour Market pillars reflect common challenges, including limited access to finance, regulatory barriers and gaps in workforce capabilities. Environmental Sustainability remains another challenge, underlying a growing risk to these economies’ rich tourism-generating natural resources.
Overall, these findings suggest that the next stage of convergence will depend less on attracting visitors and more on supporting them and travel and tourism businesses. Many major emerging tourism economies already possess the assets associated with tourism success. What separates them from the leaders is the depth of the infrastructure, services and enabling conditions needed to support tourism.
Figure 10: Gap between the 10 largest emerging and the top 20 average by TTDI pillar, 2026

4.4 Regional performance
Overall T&T development conditions improved across every region between 2024 and 2026, but the pace of progress varied considerably (see Figure 11). Asia-Pacific and the Middle East and North Africa (MENA) recorded the strongest gains, with average scores increasing by 3.6% and 2.5% respectively. Growth was more modest in Europe and Eurasia (+1.8%) and the Americas (+1.6%), while sub-Saharan Africa recorded the slowest improvement at 1.1%.
Figure 11: Regional TTDI performance, 2026
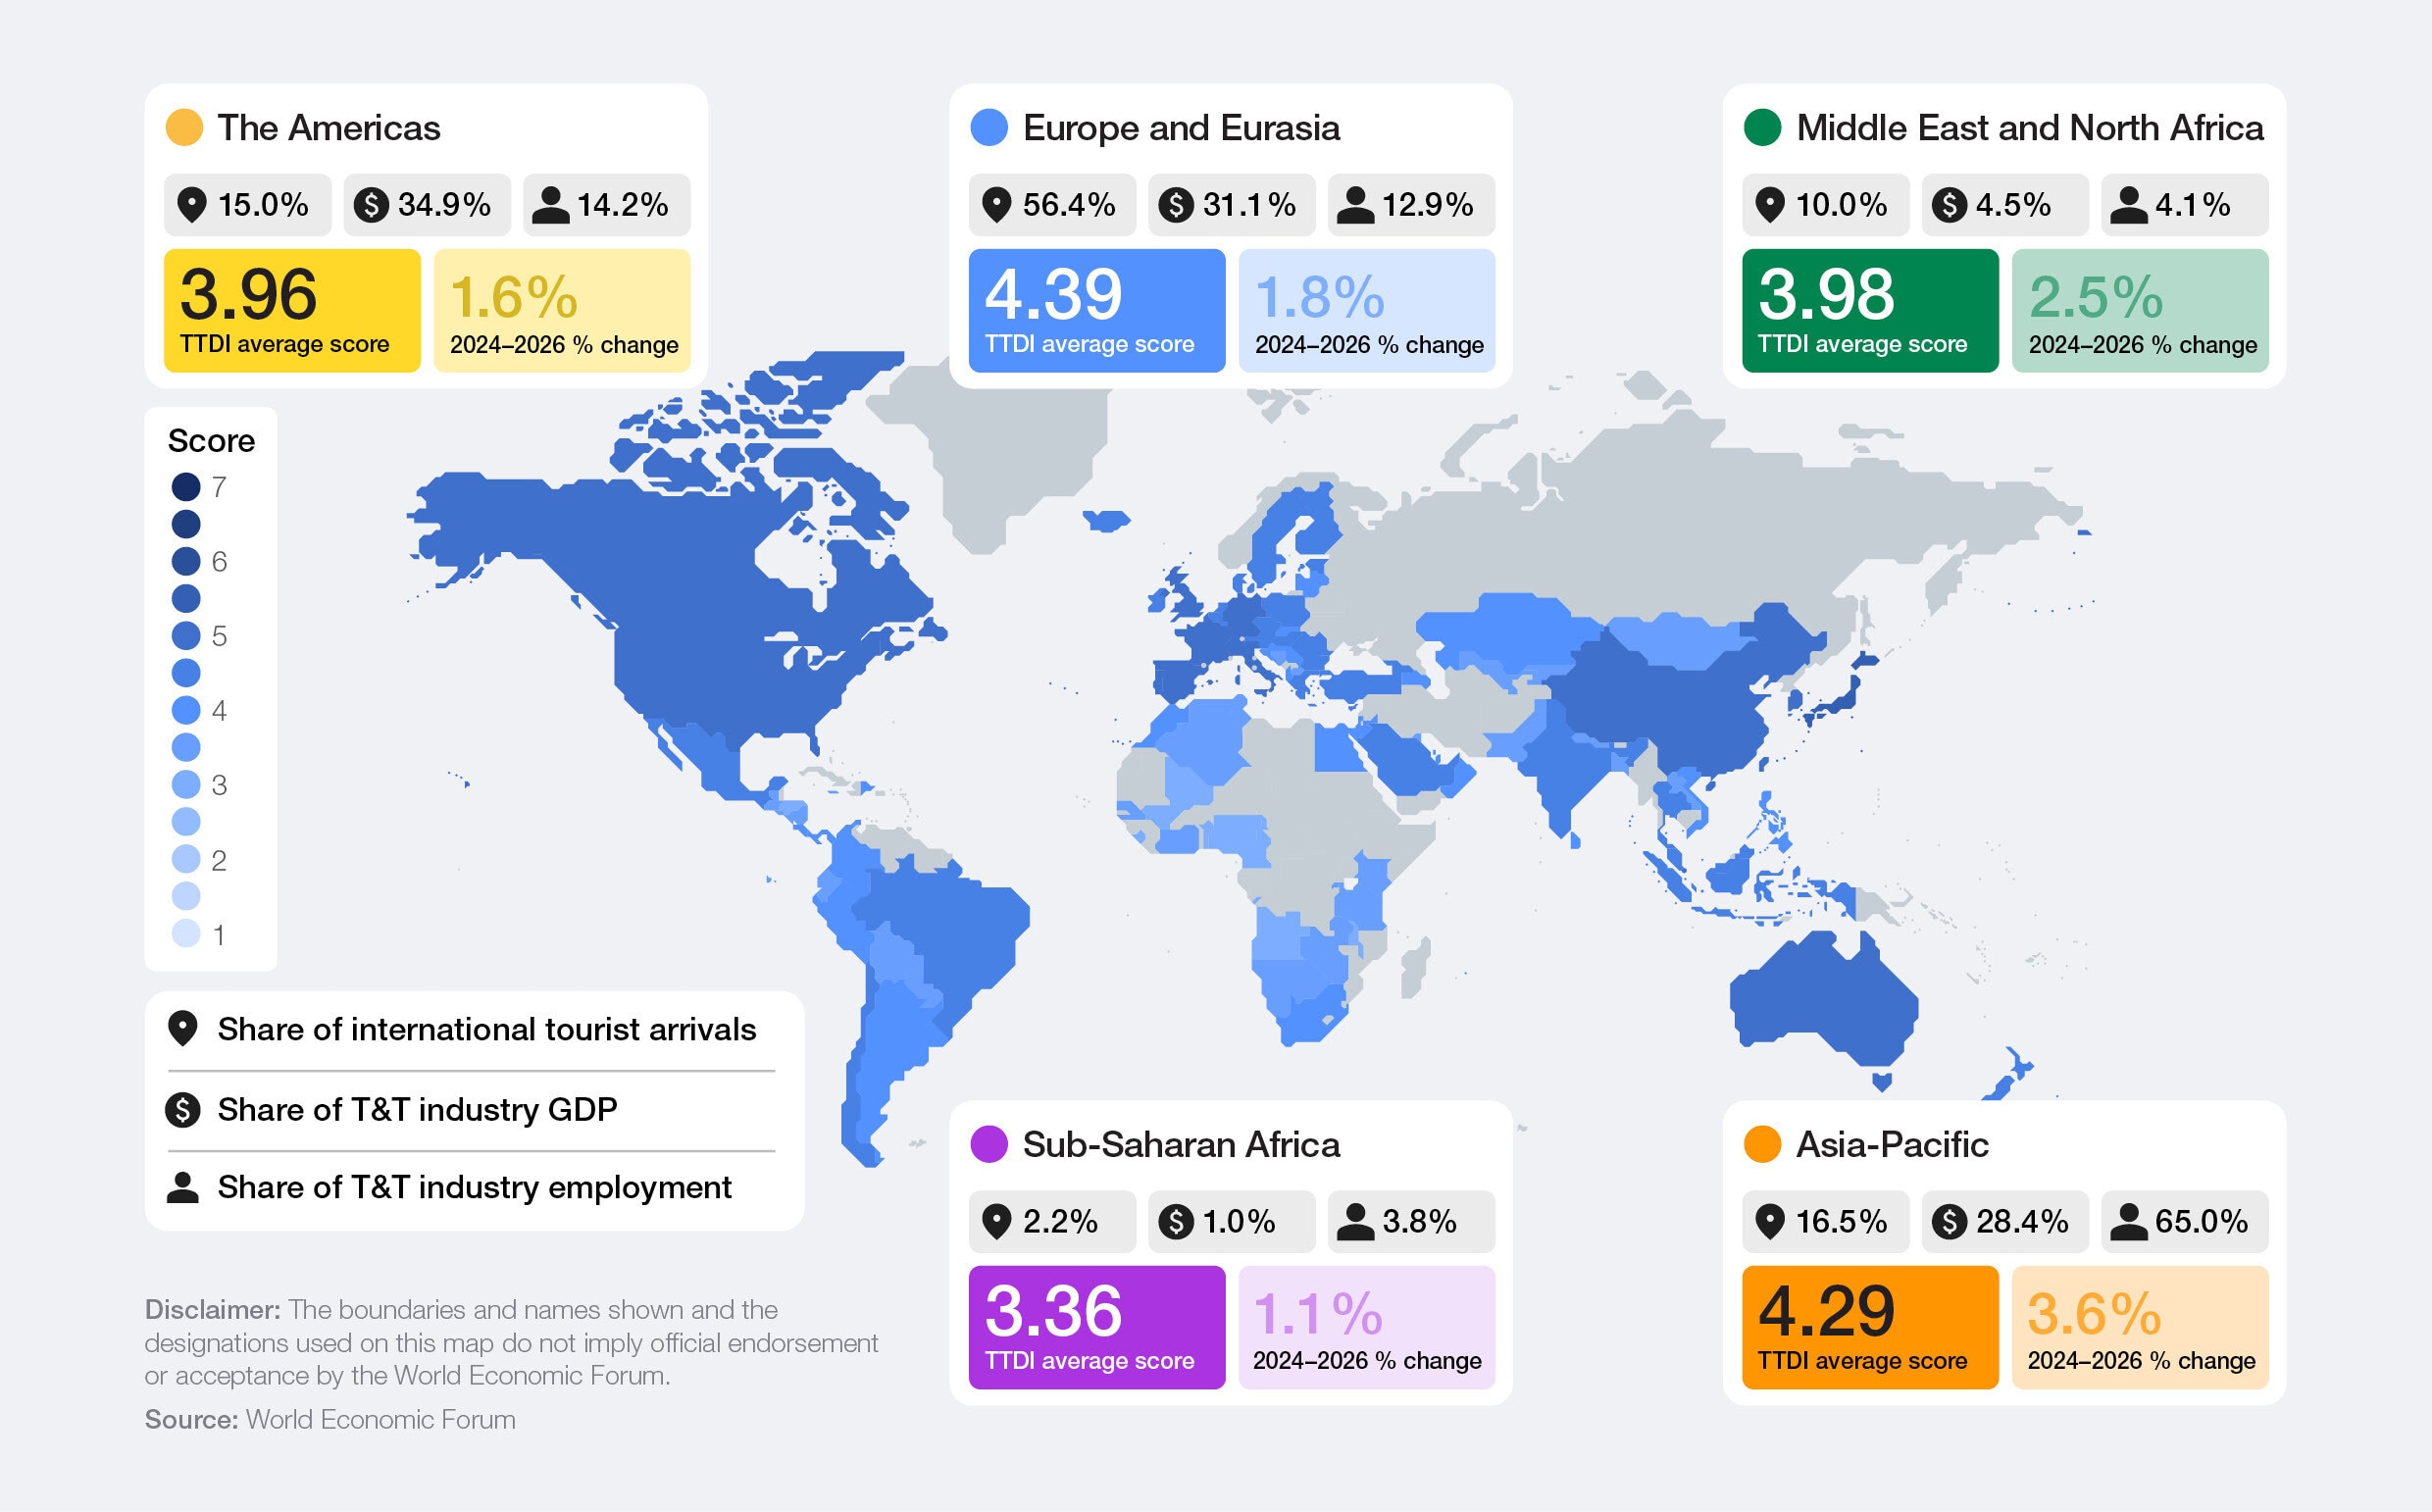

Looking beyond the latest cycle, the results point to a widening development gap. Between 2019 and 2024, average regional scores changed relatively little. Since then, Asia-Pacific and MENA have accelerated, narrowing the gap with Europe and Eurasia, while sub-Saharan Africa has made more limited progress.
In Asia-Pacific, gains were driven by improvements in Cultural Resources, Air Transport Infrastructure and Non-Leisure Resources, reflecting stronger connectivity and growing business and visitor capacity. MENA followed a similar pattern, with particularly strong gains in Cultural Resources, Tourist Services and Infrastructure, and T&T Demand Sustainability.
Europe and Eurasia remain the highest-performing region overall. Recent gains were concentrated in Tourist Services and Infrastructure, Cultural Resources and Air Transport Infrastructure. However, these improvements were partly offset by declining price competitiveness as travel, accommodation and operating costs continued to rise.
While the Americas recorded solid improvements in Cultural Resources, Tourist Services and Infrastructure, and Air Transport Infrastructure, overall regional progress was held back by a decline in Price Competitiveness. This suggests that although many destinations continue to strengthen their tourism offer and connectivity, rising costs are making it more difficult to convert these gains into stronger overall performance.
Sub-Saharan Africa followed a different trajectory. Progress was concentrated in ICT Readiness, Prioritization of T&T and Cultural Resources. However, weaker performance on T&T Demand Sustainability and T&T Socioeconomic Impact limited overall gains. As a result, the gap between sub-Saharan Africa and all other regions has continued to widen.
4.5 Subregional performance
Regional averages mask significant variation within regions. At the subregional level, clear differences emerge in how destinations perform across the TTDI pillars (see Figure 12). The results show that T&T performance is shaped not only by geography but also by the mix of resources, infrastructure and enabling conditions that underpin development.
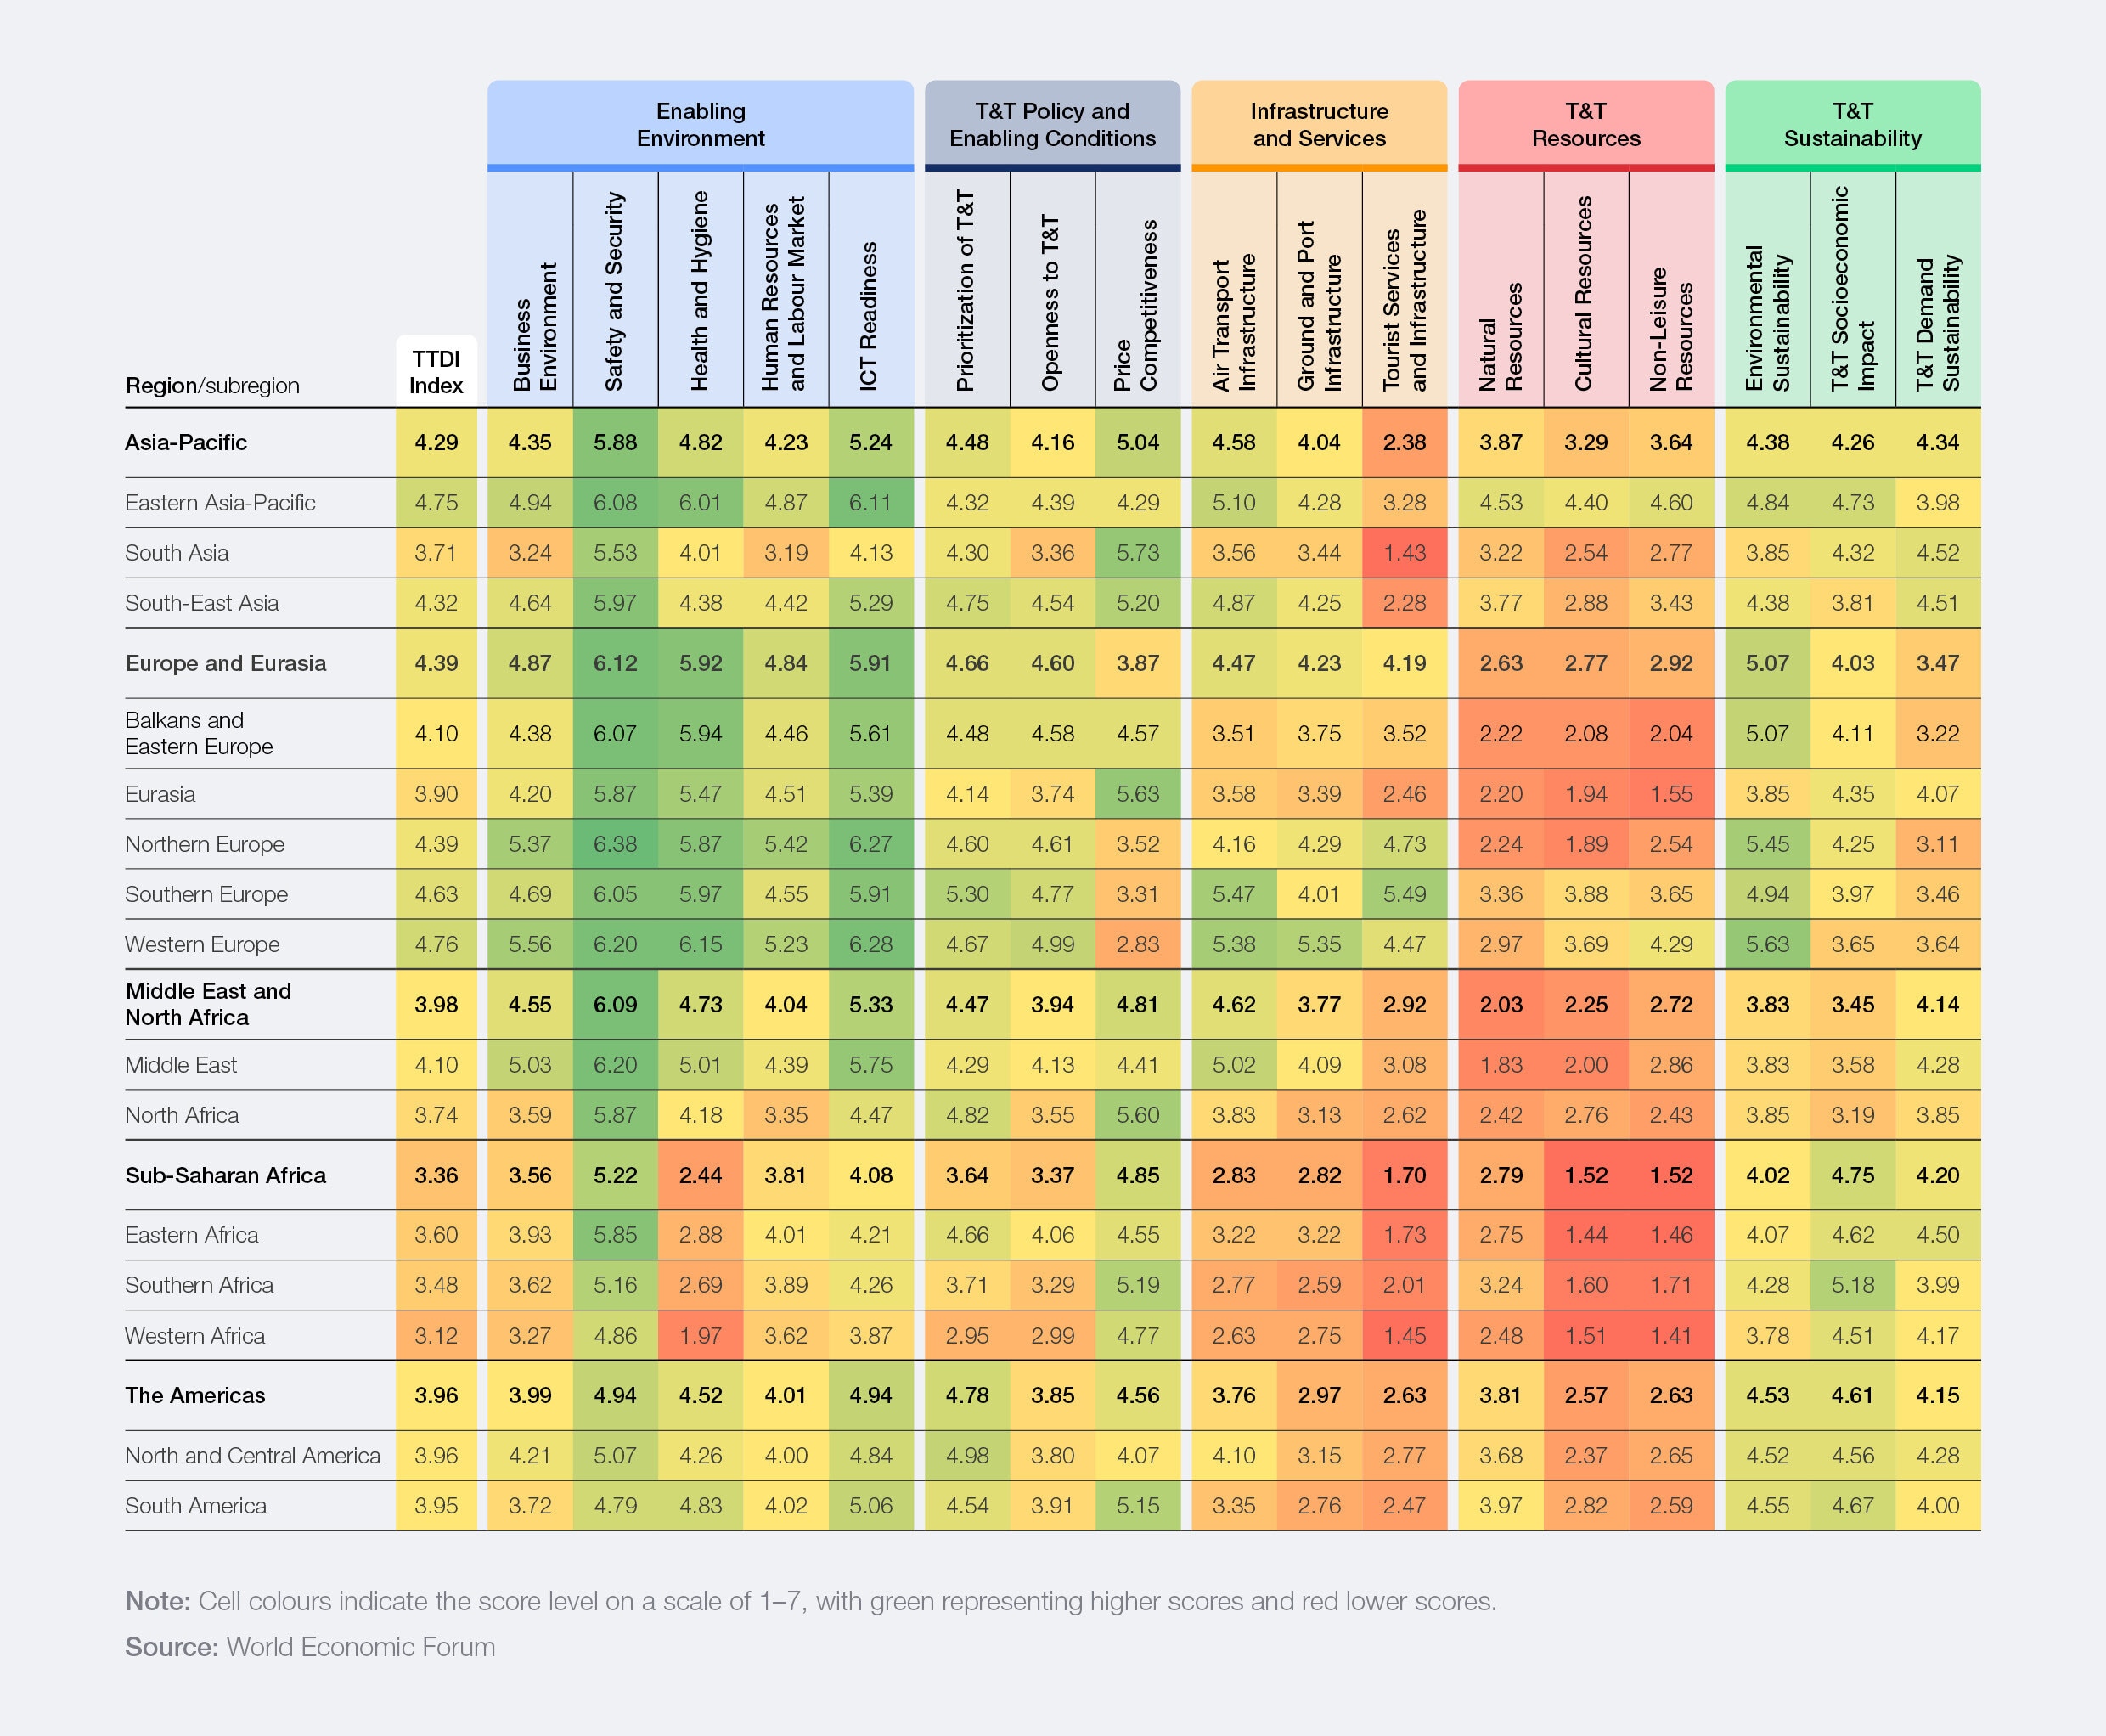

Western Europe, Eastern Asia-Pacific and Southern Europe remain the highest-performing subregions. All three score highly on Cultural Resources and Air Transport Infrastructure, although their profiles are not identical. Western and Southern Europe stand out for Tourist Services and Infrastructure, while Eastern Asia-Pacific is the strongest-performing subregion in Natural Resources. Across all three, Price Competitiveness remains a relative weakness.
The chart shows that strong tourism performance can be achieved through different combinations of strengths. The Middle East performs particularly well on Air Transport Infrastructure and ICT Readiness, while North and Central America and South America benefit from rich natural assets.
Western Africa, Eastern Africa and Southern Africa face challenges across several pillars, most notably on Health and Hygiene, Tourist Services and Infrastructure, Air Transport Infrastructure and Non-Leisure Resources. Yet they score relatively highly on T&T Socioeconomic Impact, highlighting tourism’s importance to local economies despite structural constraints.