Energy Transition Index 2026


3. Sub-index and dimension trends
Declining security and a decade-first reversal in transition readiness signal a widening gap between current delivery and future preparedness.
3.1 System performance
Box 7: System performance key takeaways
- System performance improved only marginally. 2026 saw gains in equity and sustainability, but a decline in security limited overall progress and highlighted uneven movement across dimensions.
- Structural vulnerabilities continued to weigh on delivery. Reliability pressures, weaker supply fundamentals and uneven infrastructure readiness exposed energy systems to growing operational and geopolitical stress.
- Balanced progress is becoming harder to sustain. Rising electrification, grid constraints, volatile market conditions and external shocks are making it more difficult for countries to advance equity, security and sustainability.
System performance measures how effectively energy systems deliver across three core dimensions: equity, security and sustainability. In 2026, global system performance improved only marginally (+0.4%), signalling a slowdown in progress. Around 60% of countries improved their overall system performance scores, yet only 29 out of 120 recorded gains across all three dimensions, underscoring the growing difficulty of advancing equity, security and sustainability simultaneously. These trends point to a more complex phase of the energy transition, where progress in one dimension is increasingly accompanied by declines or trade-offs in others, making balanced system performance harder to achieve and sustain.
Figure 9: System performance: what drove the changes
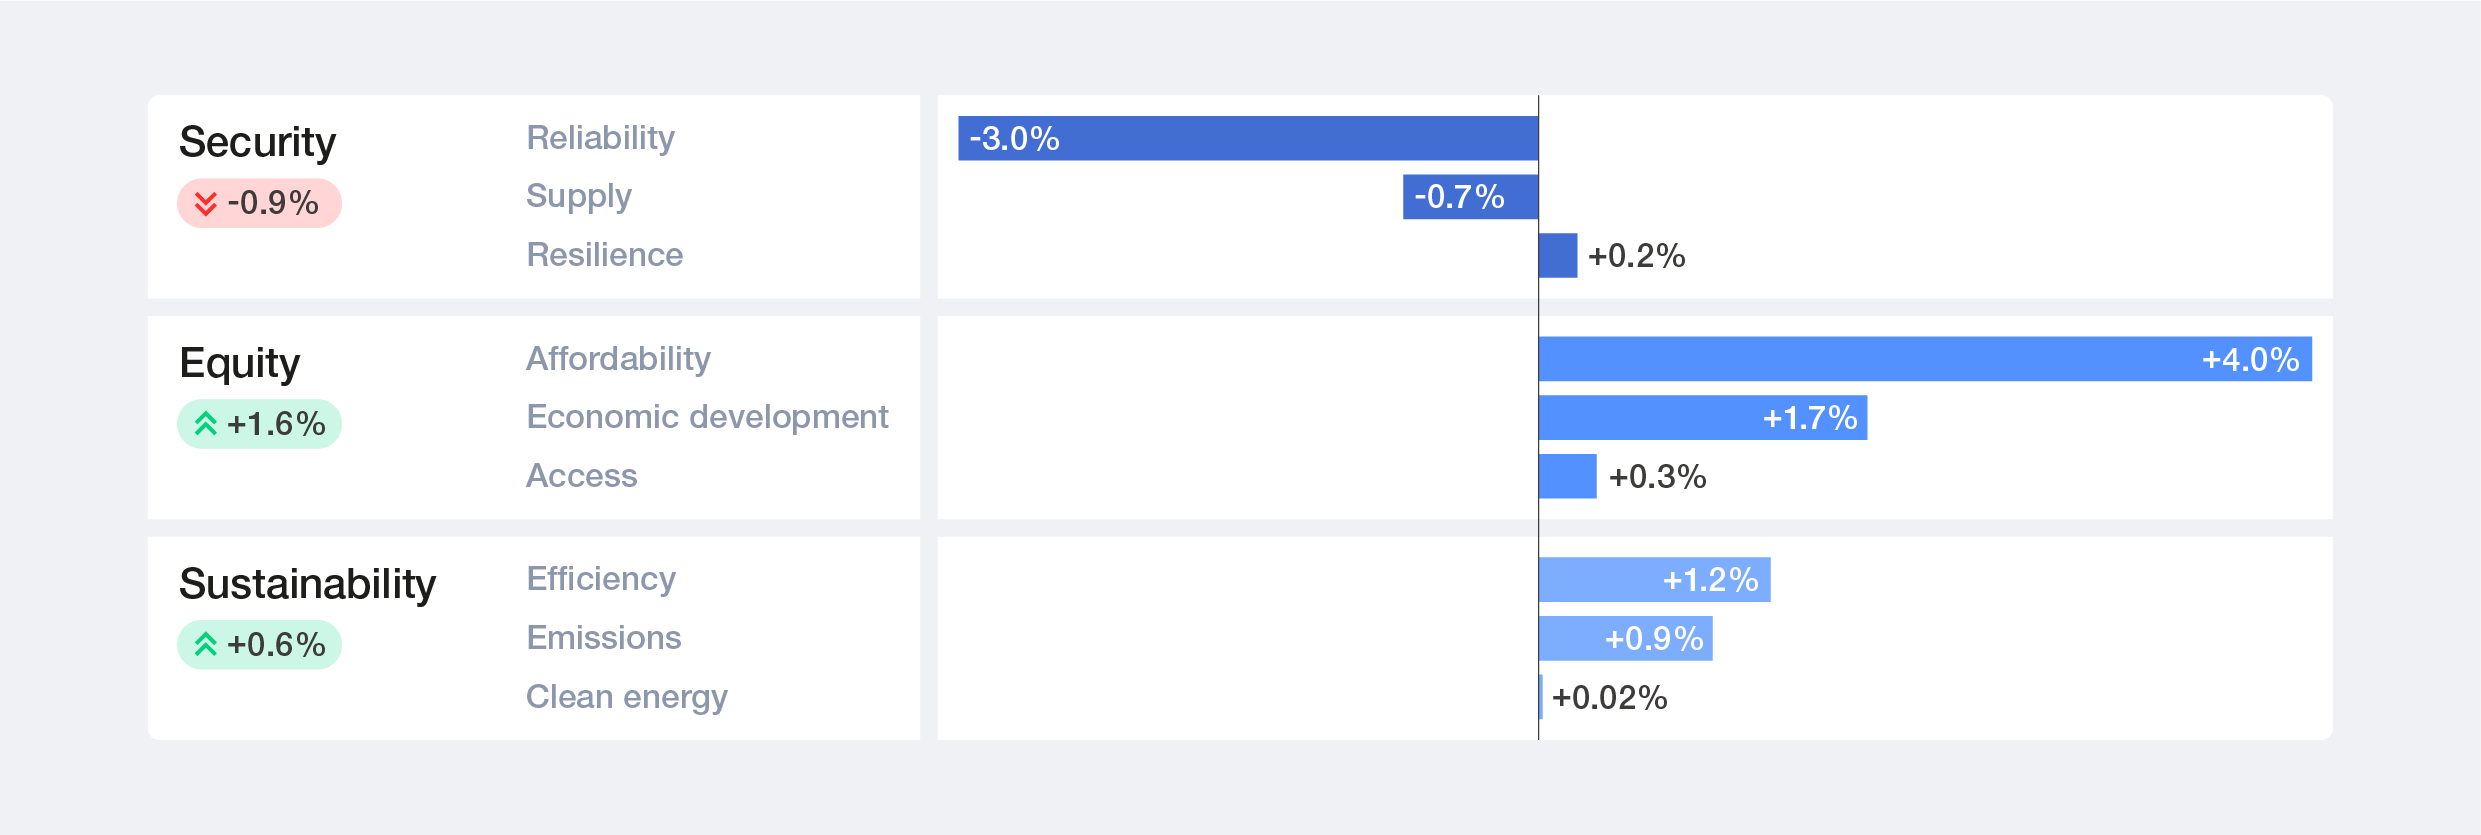

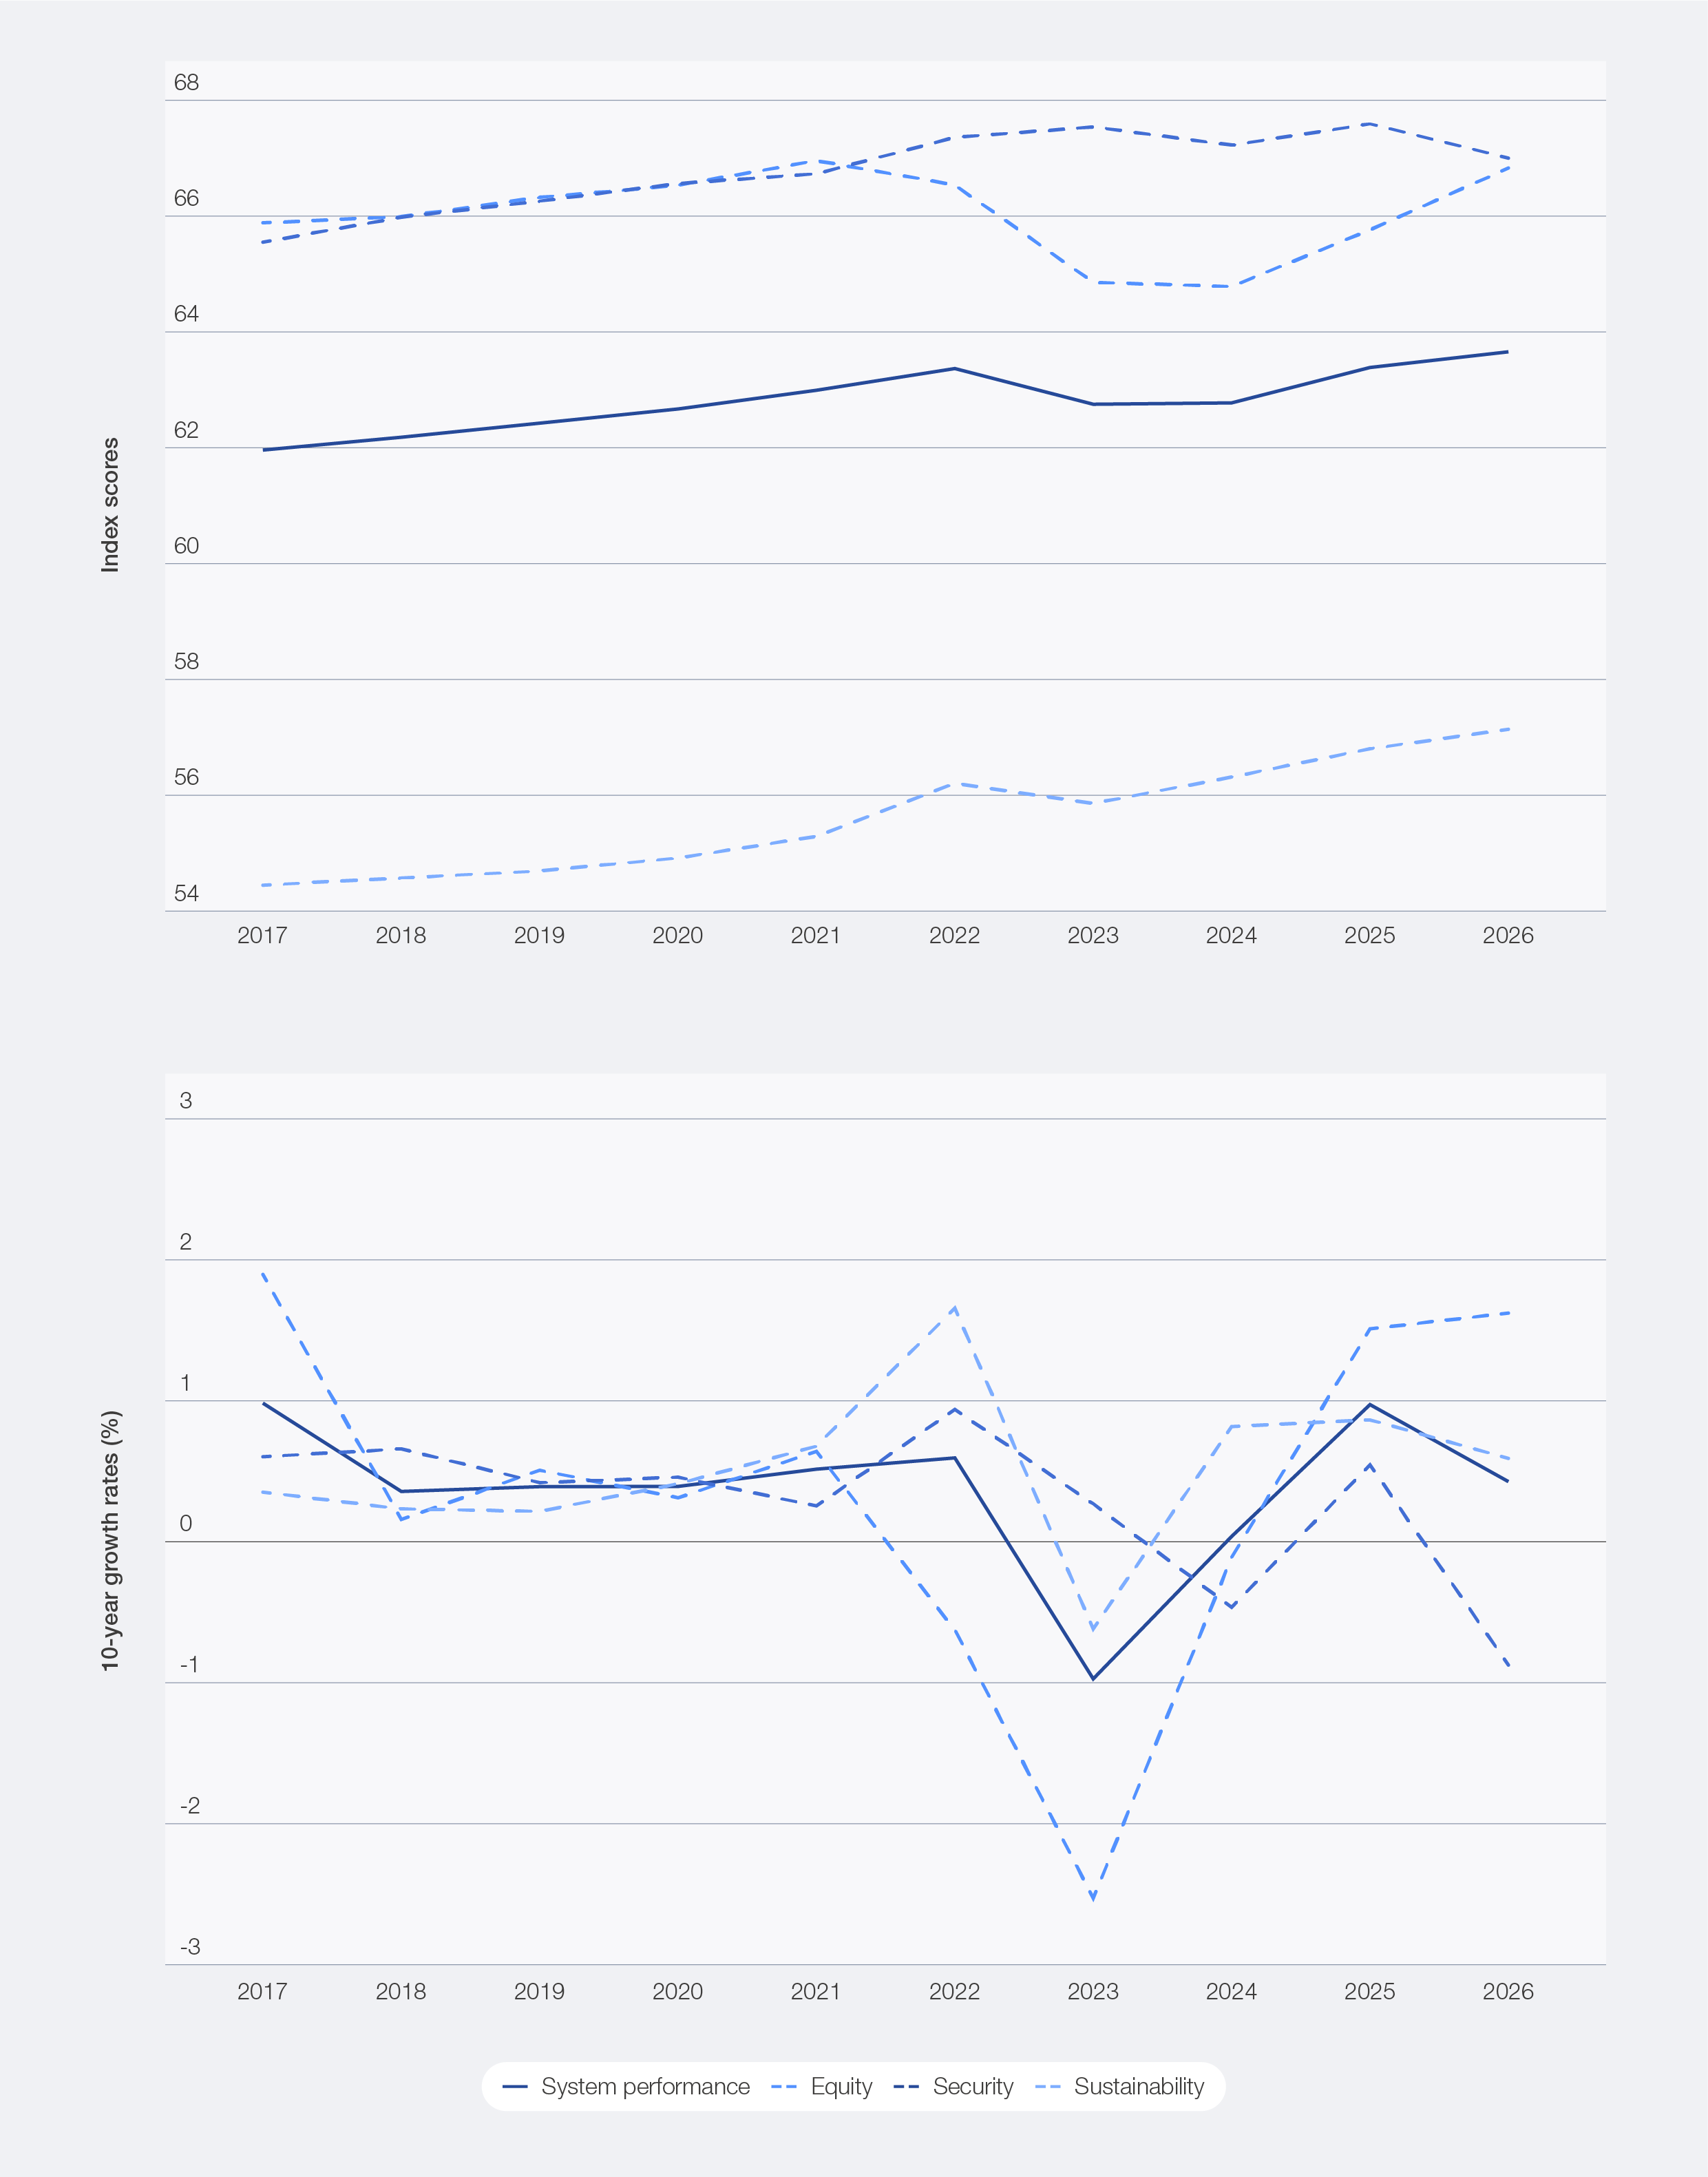
Figure 10: System performance dimension scores and growth rates, 2017–2026

Security
Security in the ETI is measured across three sub-dimensions: supply adequacy and diversification, system resilience, and grid reliability. Together, these sub-dimensions capture whether countries can source, absorb and deliver energy dependably. Energy security is re-emerging as a central priority – yet it is the only dimension of system performance to have declined in the 2026 ETI. The global average score fell by 0.9%, with 74 economies recording deterioration. This predates the acute geopolitical shocks of early 2026; the underlying data points to structural vulnerabilities in energy system reliability, supply diversification and system resilience that had been building well before the Strait of Hormuz crisis began in early 2026. The unrest in the Middle East may deepen these vulnerabilities further.
Advanced economies such as the US and Iceland continue to lead in absolute performance, but their scores also declined, highlighting that even mature systems are increasingly being exposed to new and evolving risks.
Figure 11: Security dimension trend 2017–2026
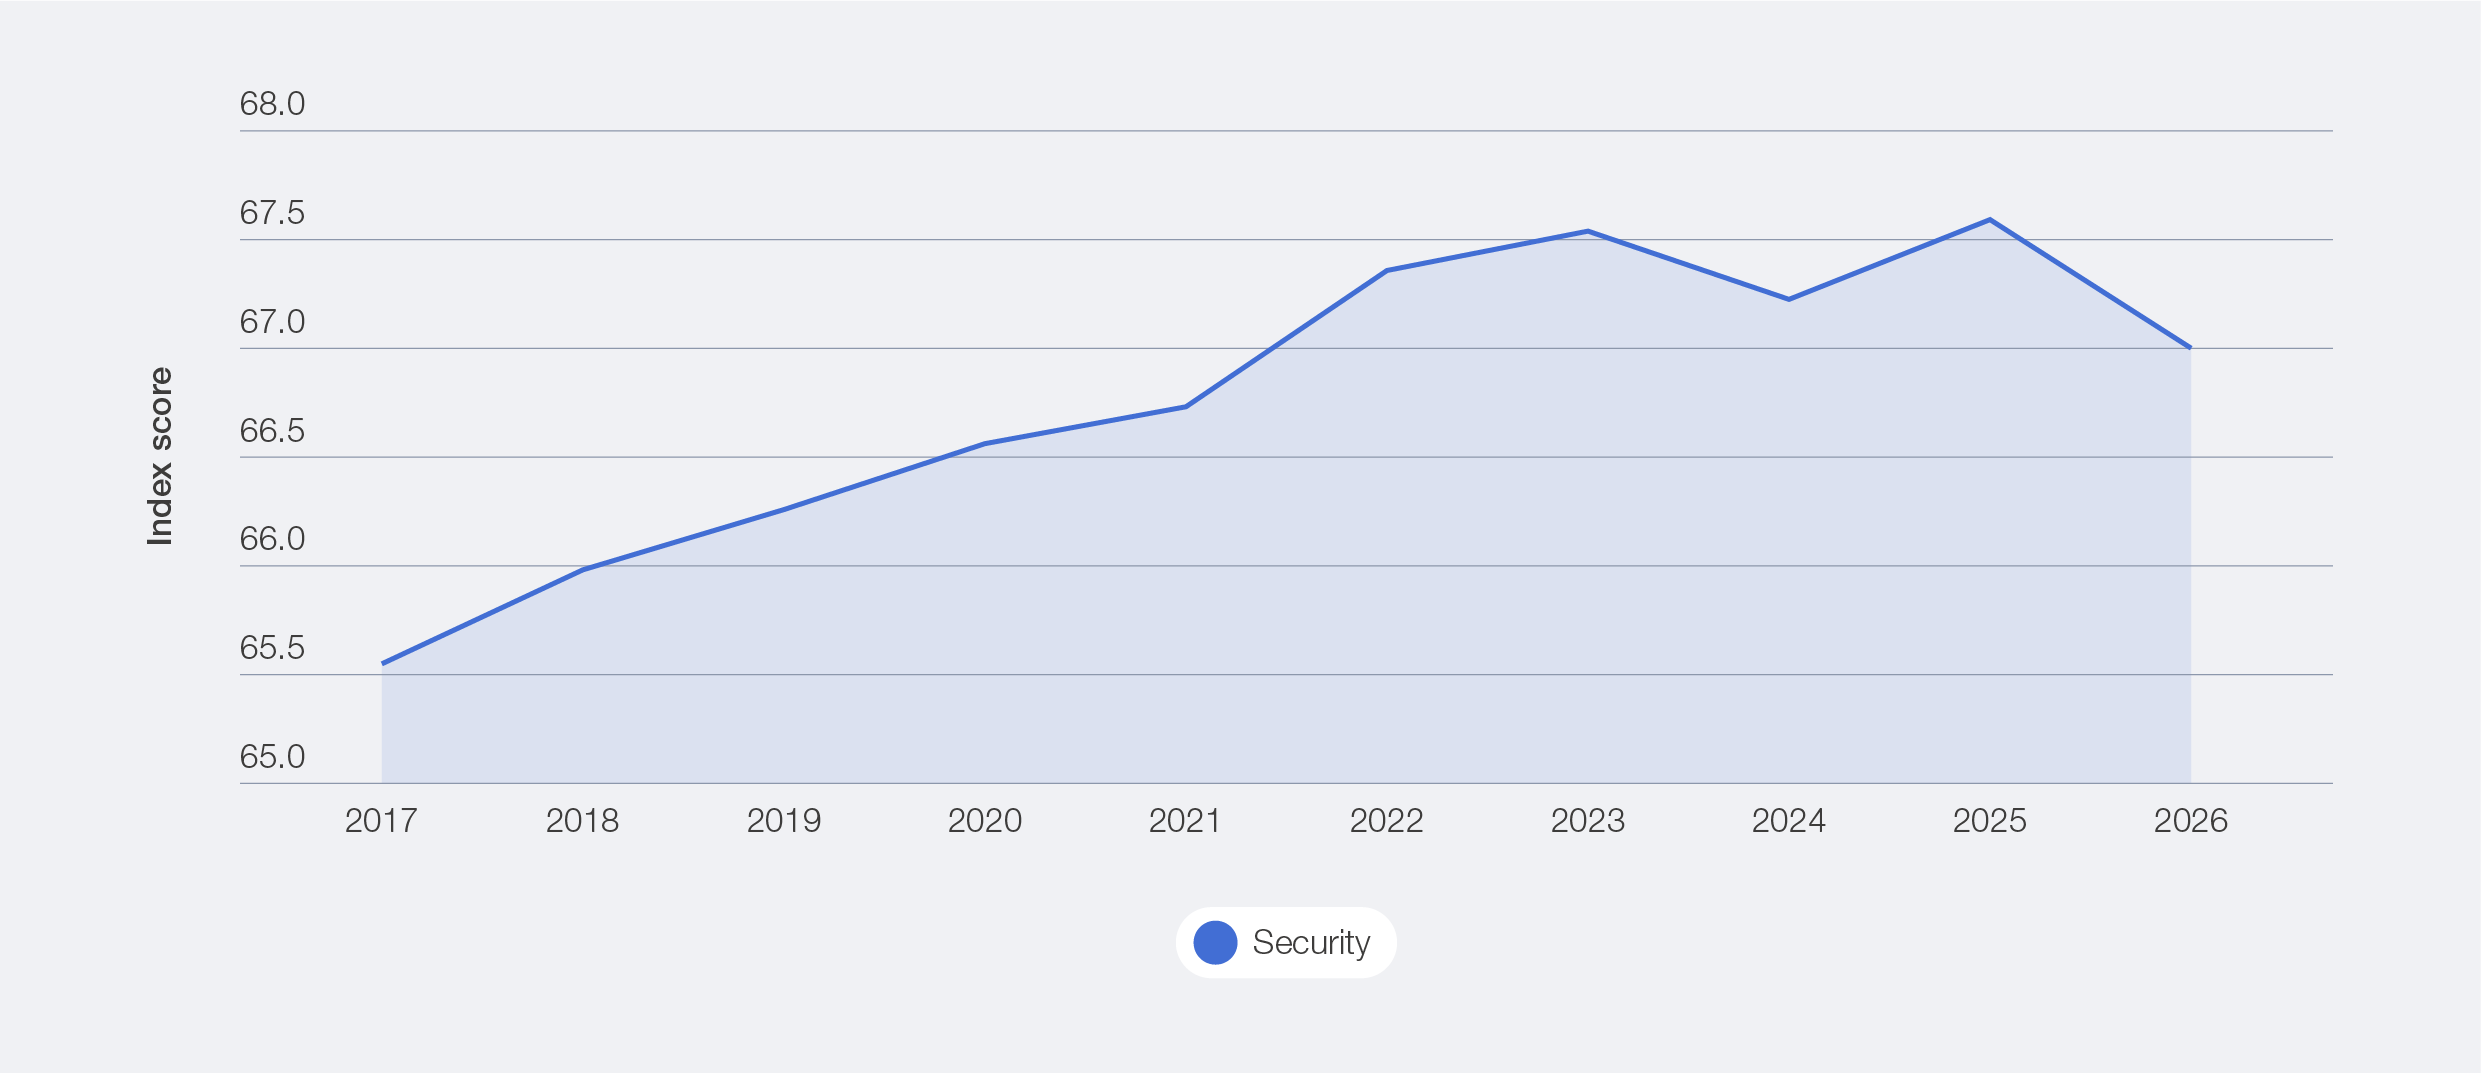

Table 2: Driving factors for the 2026 decline in security
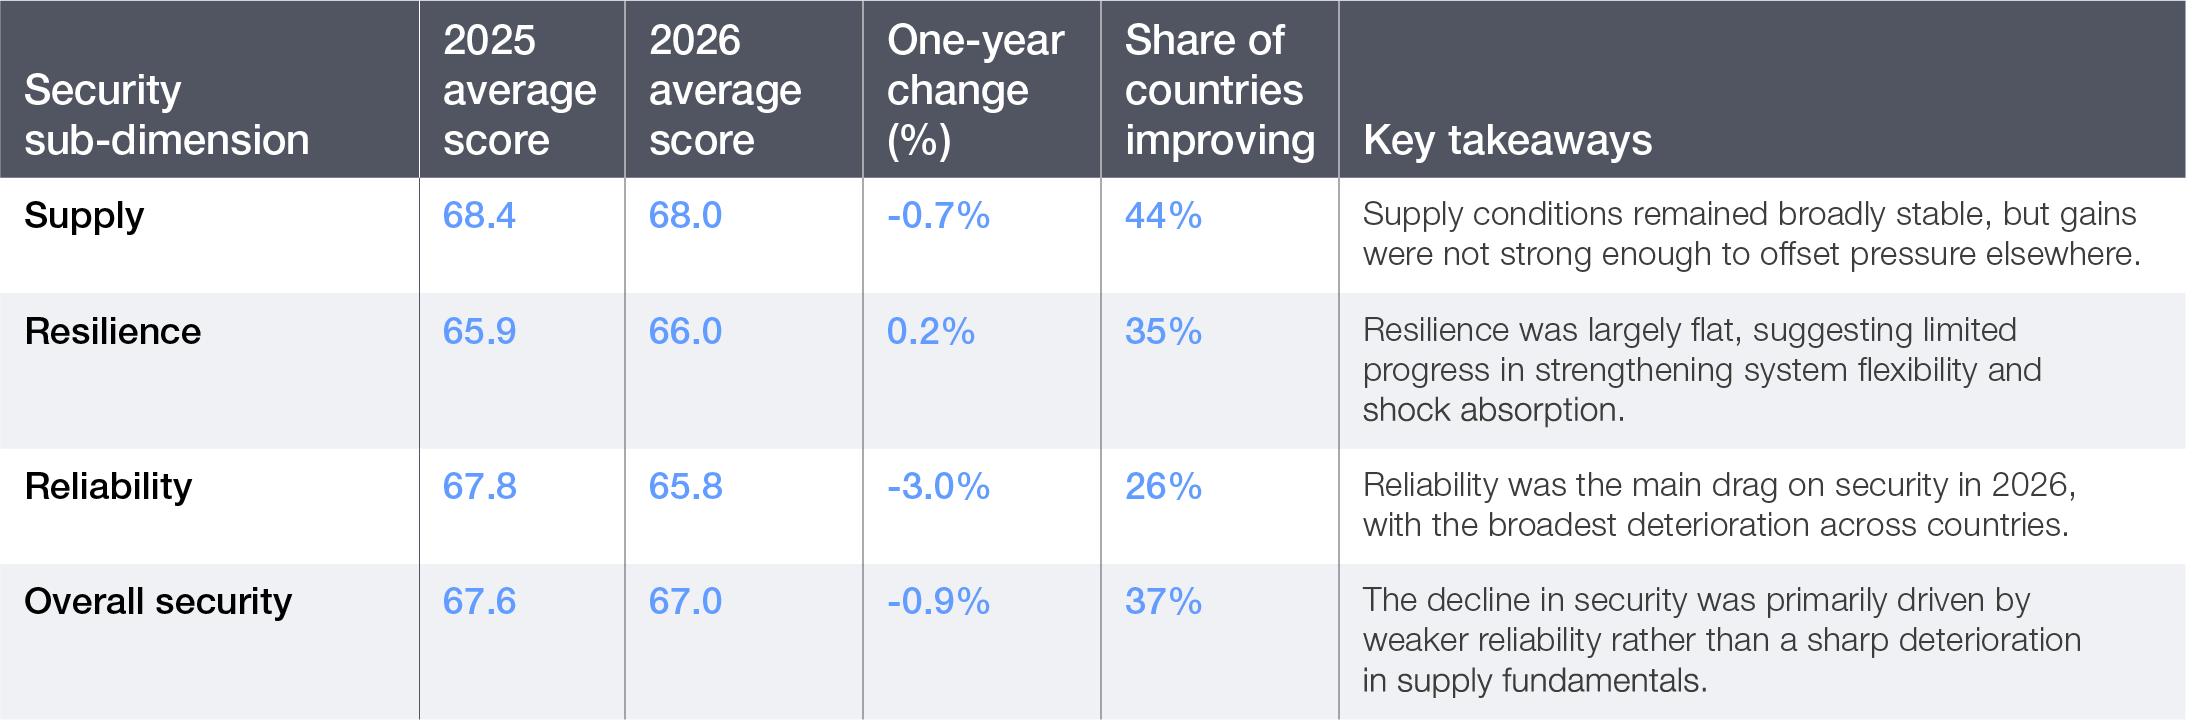

Reliability: increasing stress on power system stability
Reliability (-3.0%) was the main contributor to the decline in security, with only around one-quarter of economies improving YoY.
– The introduction of a broader reliability indicator (reliability of electricity supply62), which has replaced the System Average Interruption Duration Index (SAIDI) and System Average Interruption Frequency Index (SAIFI) indicators in this year’s ETI framework, contributes to the observed decline, but the underlying trends also point to a real deterioration in system reliability. The legacy SAIDI and SAIFI indicator data was outdated, while the new indicator provides a more current and comprehensive view of reliability conditions. The decline should therefore be interpreted as a signal that more recent measurements are revealing reliability pressures that were previously under-captured.
– Power system stress is increasing as electricity demand grows by 3–4% annually, driven by the accelerating electrification of transport, industrial heat, cooling and data centres.63
– Declining network performance, as seen in higher transmission and distribution (T&D) losses – e.g. France (-2.2%), Italy (-3.5%) and Australia (-3.3%) – signals growing inefficiency and strain in energy systems, even in advanced infrastructures.64
Supply: rising exposure and concentration risks
Supply-side security is also weakening (-0.7%), with all three underlying indicators – diversification of import partners, diversity of the energy mix and net energy imports – declining in 2026. Together, these trends lead to increased risks of supply partner concentration, reduced diversification in the energy mix and greater exposure to external supply shocks.
– Rising net energy import dependence – the Netherlands (-15.4%), the United Kingdom (-6.3%) and Spain (-6.1%) – and declining diversification of import partners are increasing exposure to external supply shocks.
– Geopolitical risks will continue to amplify these pressures. The Strait of Hormuz, through which approximately 20 million barrels per day of oil65 and 20% of global LNG flows,66 exemplifies the kind of systemic chokepoint risk faced by import-dependent economies.
– Diversification must go beyond the traditional fuel mix and import counterparts to encompass infrastructure pathways, technology suppliers, critical mineral sources and strategic energy partnerships. This will require building resilience across multiple fronts simultaneously, not just securing alternative barrels.
– Biofuels are an often-overlooked diversification lever beyond their traditional sustainability role. They provide domestically produced liquid fuel alternatives that reduce import dependence and strengthen supply chain resilience. This is particularly important as geopolitical tensions refocus attention on the vulnerability of seaborne fuel trade routes.
Resilience: system flexibility struggling to keep pace
Resilience remains broadly flat (0.2%), but underlying indicators point to a growing strain. Declines in the flexibility of electricity systems and marginal growth in the diversity of electricity supply suggest that the capabilities required to manage increasing system complexity – including storage, demand response and grid responsiveness – are not keeping pace.
- Lower system flexibility results (-0.31% YoY) point to growing difficulty in balancing supply and demand as systems integrate higher shares of variable renewable energy.
- Similarly, advanced systems also witnessed a decline in resilience – such as Belgium (-3.0%) and Finland (-3.6%) – highlighting constraints in adapting to rising volatility and system complexity.
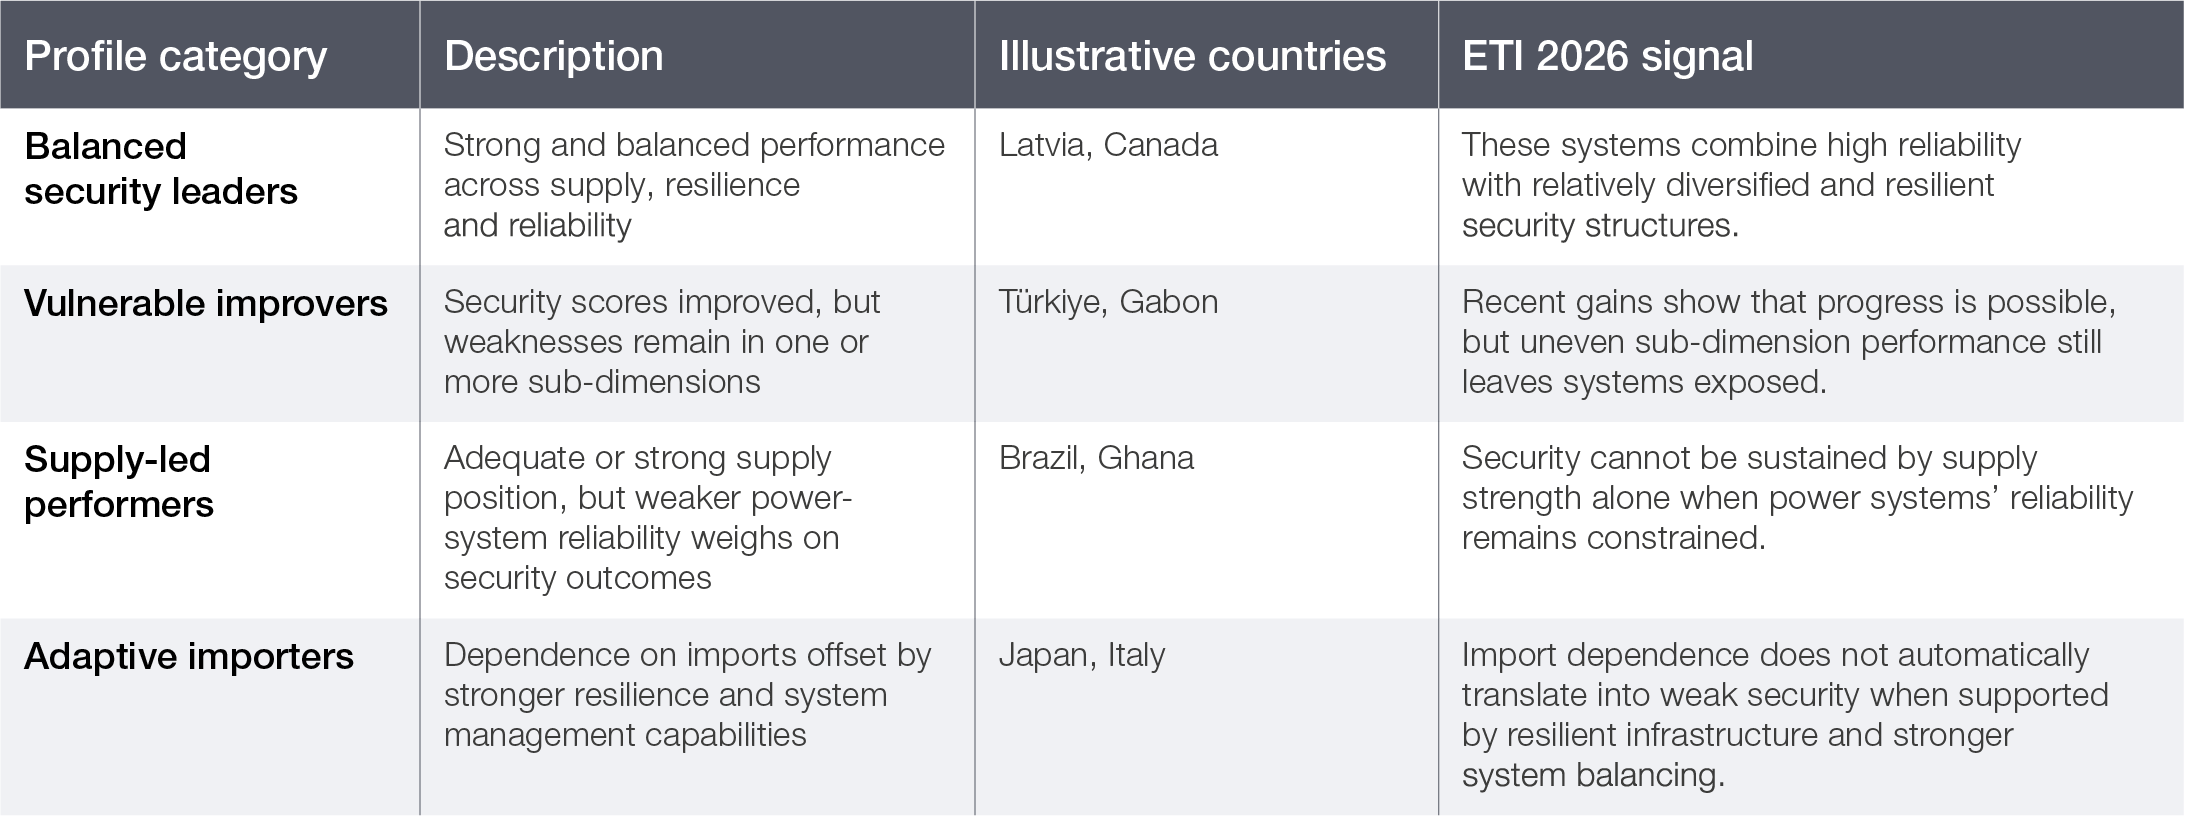
Table 3: Security profiles in ETI 2026

Together, these trends signal a fundamental shift in energy security from a focus on resource availability to a broader challenge of managing system complexity in a volatile and interconnected world in a way that safeguards energy security. As geopolitical risks intensify and demand continues to grow, strengthening reliability, diversifying supply and enhancing system resilience through physical hardening and deployment of innovative system optimization digital tools will be critical not only to energy security but to sustaining the broader energy transition.
Equity
Equity in the ETI is measured across three subdimensions: energy access, affordability, and economic development and growth. Together, these sub-dimensions capture whether the benefits of energy systems reach populations broadly and at a manageable cost. Although energy prices have partially eased from their 2022–2023 crisis peak – driving the affordability rebound captured in the ETI scores – they remain above pre-crisis levels in most markets, and the renewed price pressures from the 2026 Middle East conflict are not yet reflected in these scores.
Equity was the strongest-moving dimension (1.6%) of system performance in ETI 2026, continuing the recovery from the sharp deterioration observed in 2023 and 2024. The rebound was broad-based, with 89 countries improving. The Middle East, North Africa and Pakistan retained the highest average equity performance. Emerging Europe recorded the largest YoY gains, reflecting a geographically diverse recovery driven by different underlying dynamics.
Figure 12: Equity dimension trend, 2017–2026
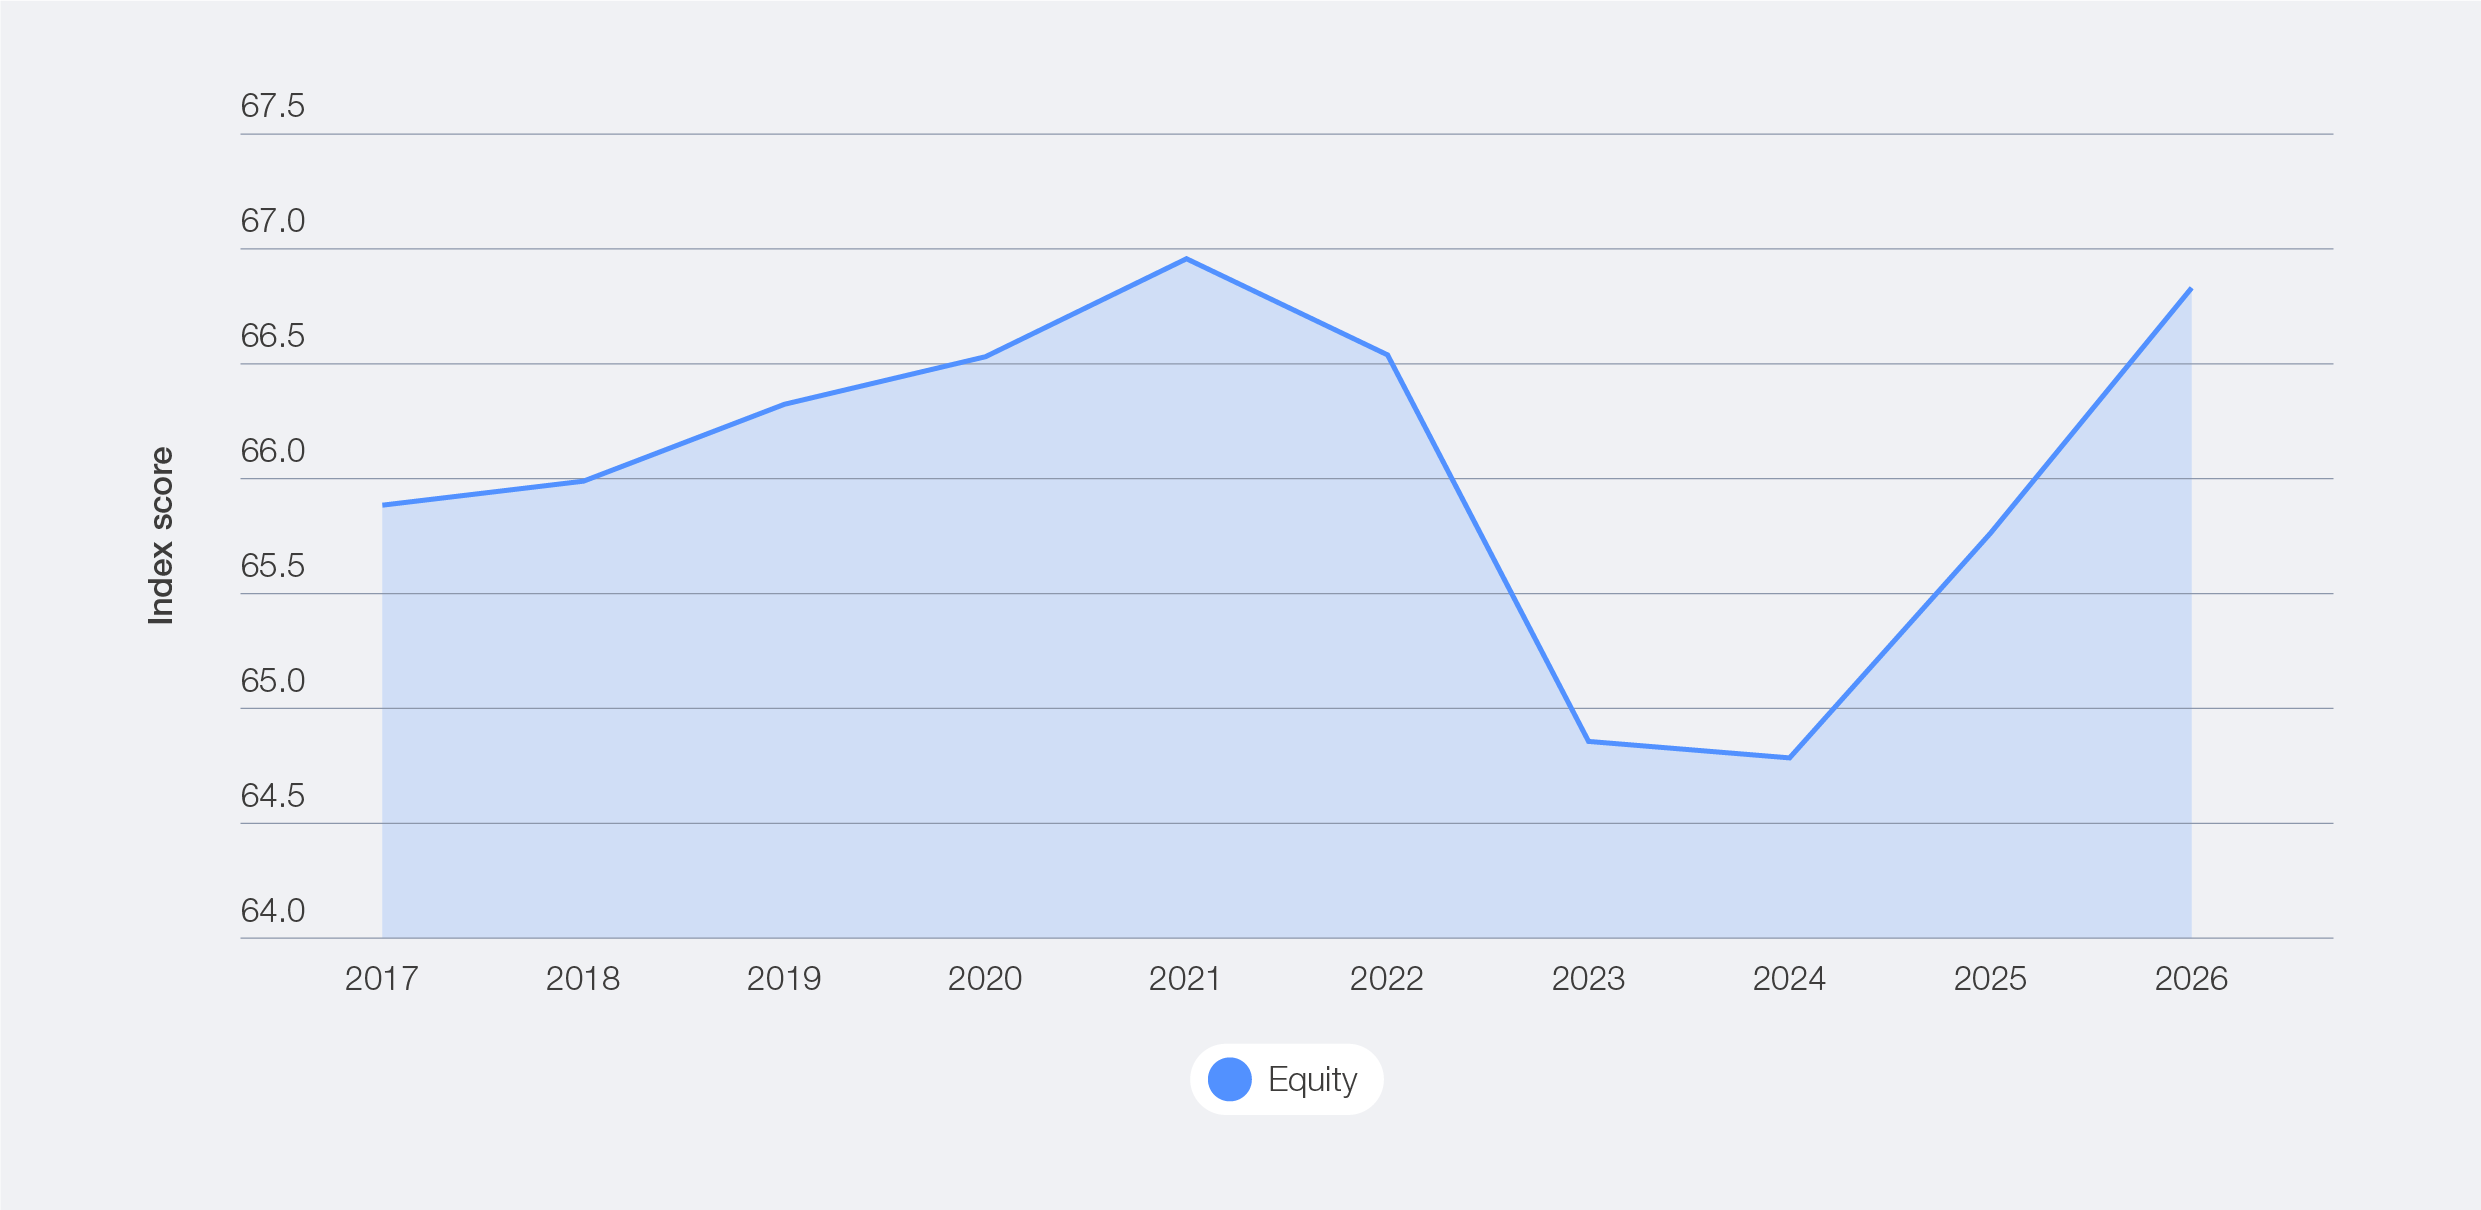

Table 4: Driving factors for 2026 improvement in equity
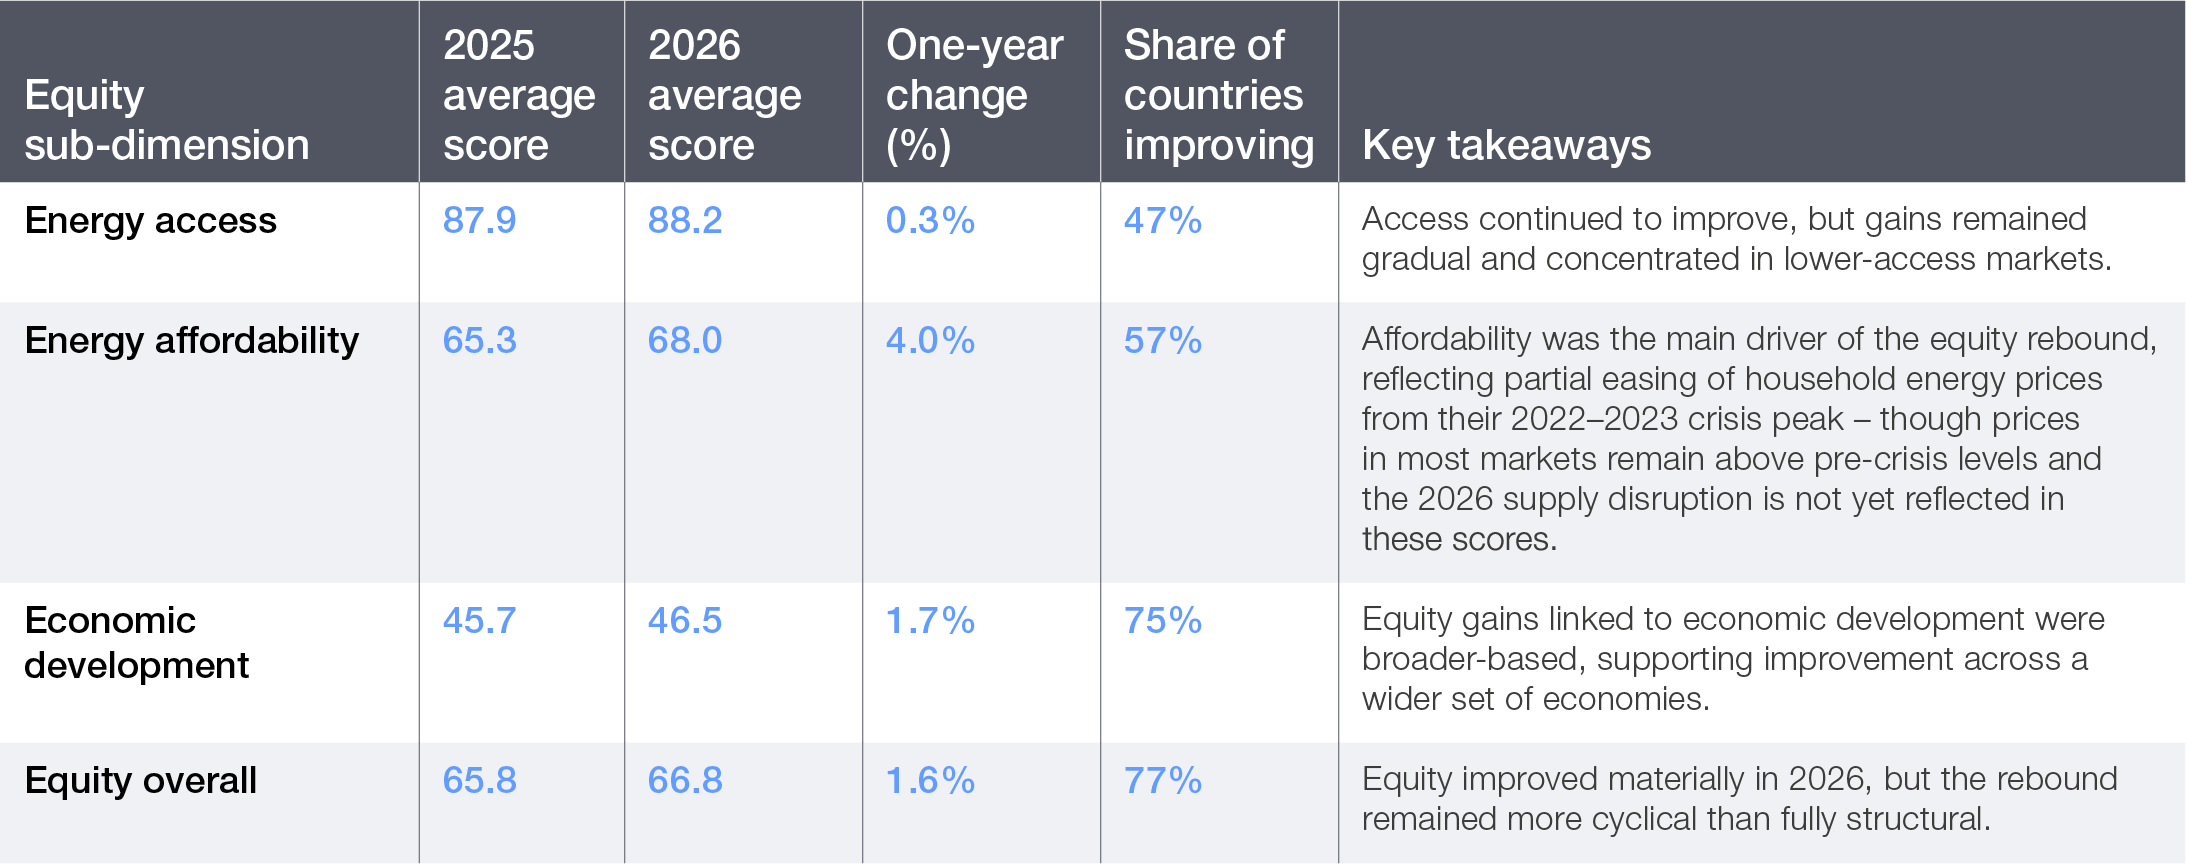

Energy access: progress continued, but remained uneven
Energy access remained the most stable component of equity and continued to improve gradually, with gains concentrated on lower-access economies.
- The greatest improvements happened in countries that are still addressing structural deficits, including the Democratic Republic of the Congo (+19.1%), Cambodia (+6.0%), Senegal (+7.3%) and Ghana (+4.9%).
- At the same time, setbacks in several economies, such as Panama (-2.1%) and Colombia (-1.2%), underscore the uneven nature of this progress, driven by slower improvements in rural access and clean cooking coverage.
- Although access is increasing, progress is too slow and uneven to close the gap by 2030, especially in Sub-Saharan Africa and developing Asia.
Energy affordability: relief returned, but remains fragile
Affordability posted the strongest equity improvement (4.0%), but this must be interpreted with caution.
- Markets most exposed to the 2021–2023 energy crisis – Belgium, the Netherlands and France (up approximately 39%) and Latvia, Poland and Hungary (up approximately 25%) – recorded the sharpest reversals, but prices in most regions remain above pre-COVID-19 pandemic levels.
- Persistent structural cost drivers, network charges, carbon costs, system investment requirements and higher gas feedstock costs suggest this recovery is cyclical rather than structural. The disruption of the Strait of Hormuz reinforces this assessment, with energy price pressures already visible across major markets in early 2026.
- Switzerland (-12.4%), Portugal (-9.9%), Spain (-8.3%) and Canada (-5.9%) recorded affordability declines in 2026, underscoring that price pressures persist even in well-functioning systems.
- Since 2019, household electricity prices have risen faster than incomes and inflation in many countries, reducing purchasing power and accentuating the fragility of affordability gains.
Economic development: broader-based gains, but weaker structural foundations remain
Gains in economic development were more moderate than in affordability, but were more widely distributed, with nearly three-quarters of economies improving.
- The strongest increases were observed in Lao PDR (+27.9%), Trinidad and Tobago (+23.3%), Bahrain (+15.5%), Georgia (+10.2%) and the United Kingdom (+6.9%).
- These improvements point to stronger energy-linked economic conditions, including trade balances and the ability to translate energy availability into broader economic value.
- At the same time, notable declines in Chile (-18.8%), Mongolia (-7.9%) and Azerbaijan (-5.6%) highlight the uneven nature of progress.
- These results show that improvements in access and affordability do not automatically translate into stronger economic outcomes. In turn, this indicates a persistent gap between energy systems’ performance and broader economic inclusion.
Table 5: Equity profiles in ETI 2026
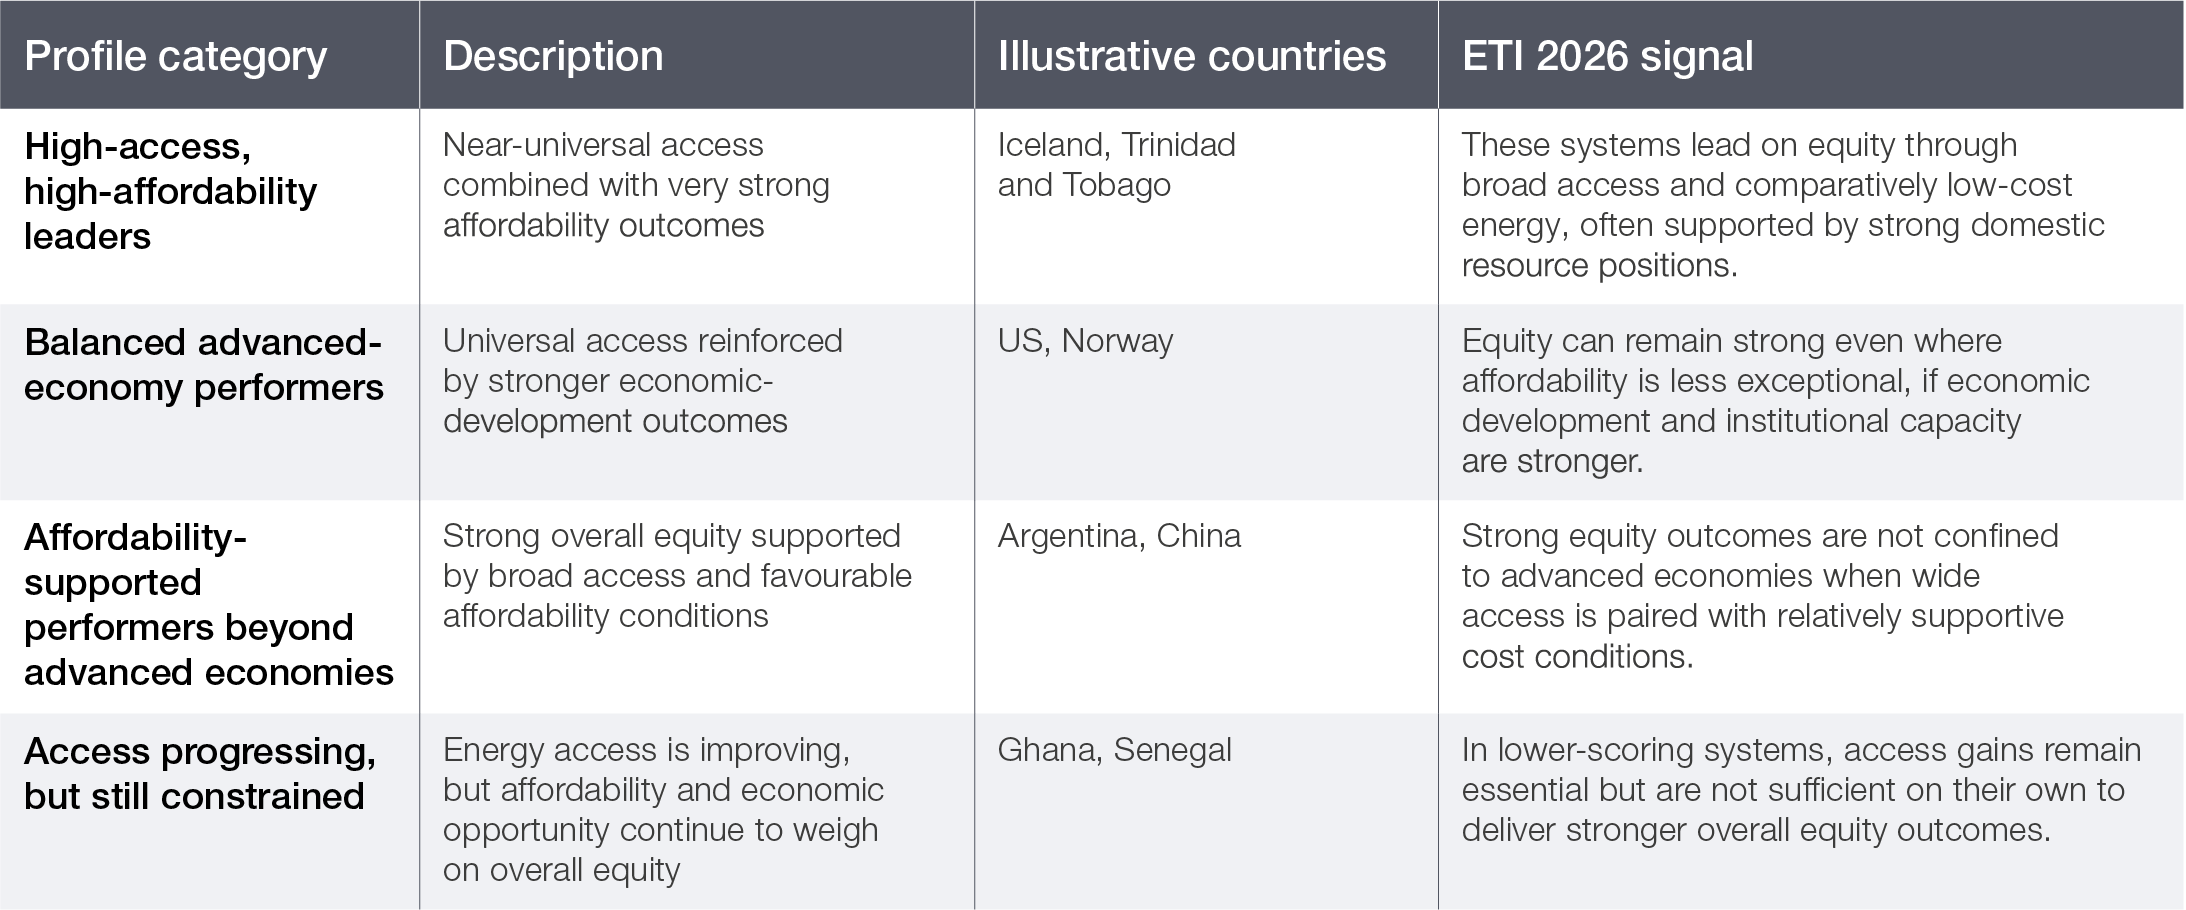

These profiles show that equity is increasingly multidimensional. Iceland and Trinidad and Tobago lead through a combination of universal access and very high affordability, while the US and Sweden pair universal access with stronger economic-development outcomes. Argentina and China show that strong equity performance can also emerge beyond advanced economies where broad access is matched by relatively supportive affordability conditions.
Overall, equity in the 2026 ETI shows meaningful improvement, but not yet on a fully durable basis. The rebound has been driven primarily by cyclical affordability relief, supported by continued gains in access and more moderate improvements in economic development. However, these gains remain fragile as underlying pressures continue to rise.
Sustainability
ETI sustainability assesses the environmental performance of energy systems through emissions intensity, energy efficiency and the share of clean energy. Energy sustainability remains a long-term anchor of the energy transition, but sustaining its progress is becoming increasingly complex. In 2025, clean energy deployment accelerated further, with renewable capacity additions reaching a record 800 GW67 and low-carbon sources supplying 42% of global electricity – the highest share ever – yet global energy-related CO2 emissions rose by approximately 0.4%, reaching a record high of 38.4 billion tonnes in 202568 due to rising electricity demand, heat-related consumption spikes and continued fossil fuel use.
The ETI’s sustainability index continued to improve (0.6%) in 2026, primarily driven by improvement in energy efficiency and lower emission intensity, but at a measured and slowing pace. This represents less than one-third of the gains recorded in the previous two years, a signal that momentum is moderating as the structural challenges of demand growth and emissions management re-emerge.
In several major economies, sustainability mandates and corporate commitments have been scaled back, policy signals have become less consistent and the political consensus around accelerated decarbonization has narrowed. This has reduced the policy pull that drove faster progress in previous years. The sustainability challenge is compounded by the reality that the global energy system is currently undergoing addition rather than substitution.
Oil demand continued to grow in 2025 (albeit at its slowest pace in years), with EV uptake keeping road transport demand in check but not yet bending the overall curve.69 Gas demand rose by around 1%, and coal consumption remained near its 2024 record.70 Renewable energy generation reached historic highs, yet total fossil fuel volumes have not declined in absolute terms. This trajectory underscores the importance of carbon management technologies, including CCUS, methane abatement and low-carbon fuels, not as alternatives to deployment but as necessary complements in sectors and regions where substitution cannot happen fast enough. Rising methane emissions from fossil fuel production underscore the need for methane abatement to remain a core component of emissions-reduction strategies, especially where fossil fuels continue to play a material role in energy supply. Overall, the improvement was broad-based, with 87 economies improving. Sub-Saharan Africa retained the highest average sustainability score, driven by strong emissions performance, however, advanced economies recorded the largest YoY improvement, followed closely by emerging Europe. This suggests that sustainability is advancing across a wide set of country contexts, but through different underlying pathways.
Figure 13: ETI sustainability dimension trend, 2017–2026
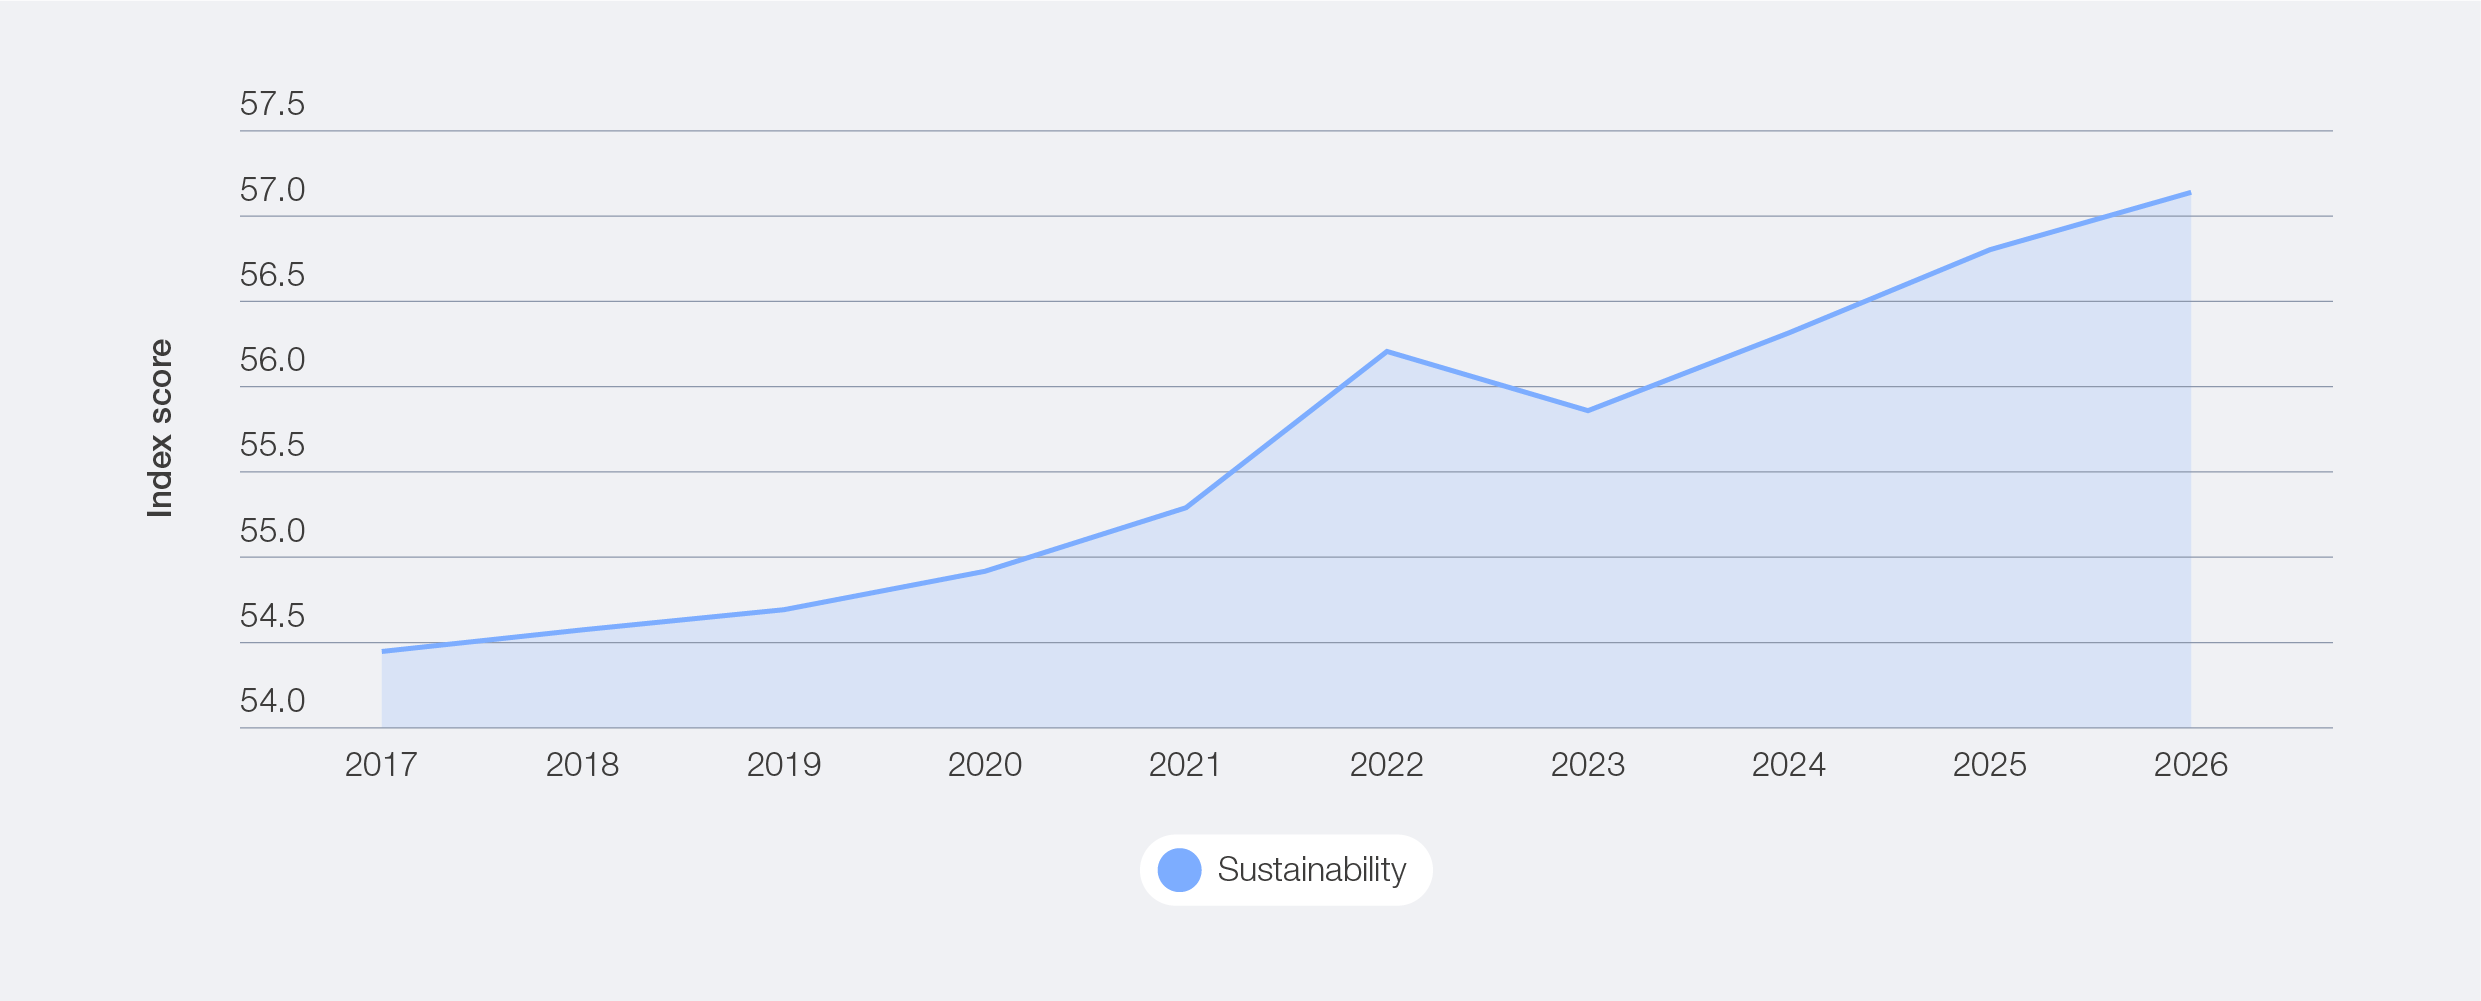

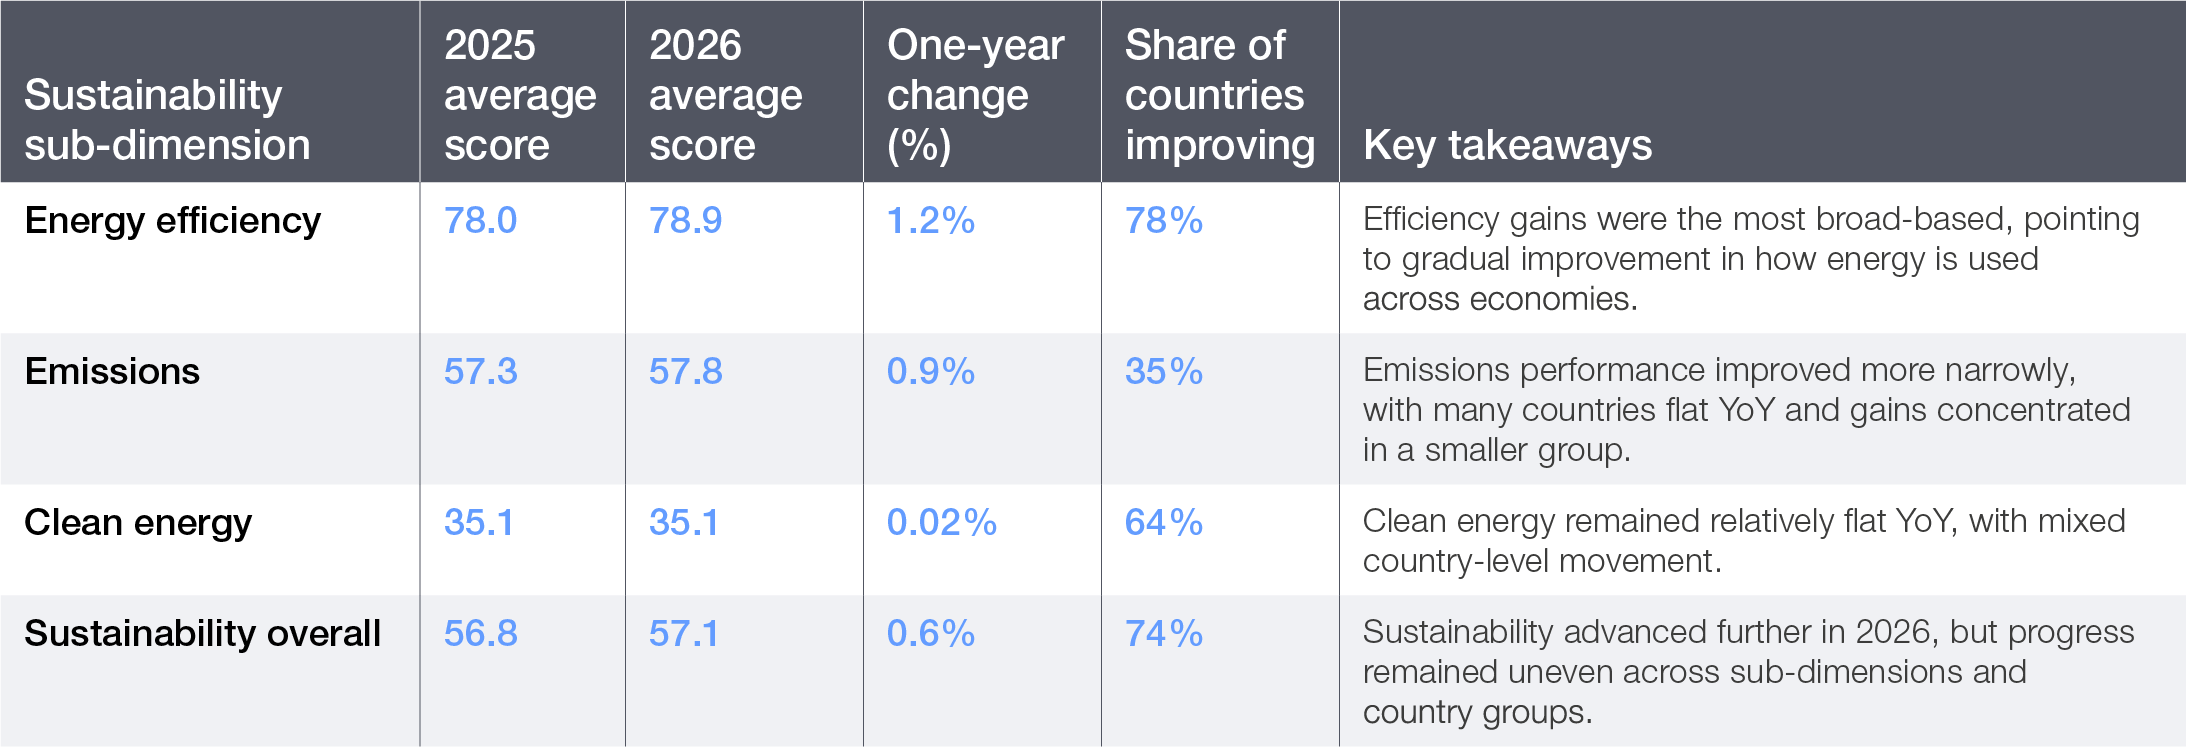
Table 6: Driving factors for 2026 improvement in sustainability

Energy efficiency: broad-based improvement, but still off pace
Energy efficiency recorded the most broad-based gains in 2026, with 92 economies improving. However, progress remains insufficient to offset the rising demand growth and the shift towards more electricity-intensive consumption.
- Some of the strongest gains were in Estonia (+7.3%) and Finland (+7.5%) – due to reduced reliance on energy-intensive fuels and, in some cases, lower industrial activity – while improvements in Australia (+3.8%) and Zambia (+3.5%) were supported by lower per-capita energy use.
- By contrast, Kuwait (-10.0%), the Republic of Moldova (-2.0%) and Mexico (-1.0%) recorded declines, driven mainly by weaker energy-intensity performance. In Iceland, fluctuations in energy-intensive industries such as aluminium production can significantly affect intensity metrics, while in Kuwait, high per-capita consumption and subsidized energy pricing continue to limit efficiency gains.
Recent estimates suggest that global progress in energy efficiency continues to improve but remains well below the pace required to meet international targets set at COP28 (the 28th Conference of the Parties for the United Nations Framework Convention on Climate Change). The energy crisis in early 2026 could draw attention to energy efficiency and ways to improve it, as it can benefit security, affordability and sustainability.
Emissions: continued progress, but less evenly distributed
The emissions dimension improved (0.9%), yet was concentrated in a smaller group of economies, while many remained flat YoY. Lower emissions intensity was the main driver of progress rather than absolute emissions reductions, underscoring the growing gap between relative efficiency gains and real-world emissions outcomes.
– Sub-Saharan Africa retained the highest average emissions score, but remained broadly flat YoY, while advanced economies and emerging Europe recorded the greatest improvements. Coal emissions alone increased by 0.9% globally, largely driven by demand growth in Asia.71
– Country-level improvements in Montenegro (+6.9%) and Luxembourg (+7.4%) were partly driven by favourable hydropower conditions and demand shifts, while Germany (+5.7%) benefited from reduced coal use, strong renewable expansion and lower industrial activity.
– At the same time, declines in countries such as Estonia (-3.2%), Sweden (-2.2%) and Slovenia (-2.5%) highlight how emissions performance remains sensitive to shifts in generation mix, weather conditions and production levels.
Rising methane (CH4) emissions from fossil fuel production add to this pressure, with CH4 emissions from the energy sector (the only indicator declining with the sustainability dimensions) highlighting the continued environmental impact of energy extraction even as systems become more efficient.
Clean energy: progress continued from a low base, but remains uneven
Clean energy marginally improved (+0.02%) in 2026, and was the least-improving driver of sustainability gains.
- Paraguay (+13.4%) and Colombia (+13.9%) saw the largest gains, supported by strong hydropower performance and expanding renewable capacity, along with North Macedonia (+14.5%), Singapore (+13.6%) and Slovakia (+6.2%).
- Simultaneously, Albania (-10.2%), Bosnia and Herzegovina (-9.2%) and Panama (-20.7%) recorded declines, illustrating that progress is not always linear, particularly in systems that rely on hydropower or are exposed to climate variability.
- Leadership remains concentrated in a relatively small group of economies. Iceland, Sweden, Finland, Norway, France and Switzerland continue to record the strongest clean energy performance, while Costa Rica remains the leading performer outside advanced economies. These results reflect strong structural advantages, including resource endowment and long-term policy support.
Increasingly, energy security and competitiveness considerations are driving the deployment of clean energy. However, the ETI 2026 results suggest that progress in this area remains uneven across countries and has not yet translated into stronger sustainability outcomes everywhere.
Table 7: Sustainability profiles in ETI 2026
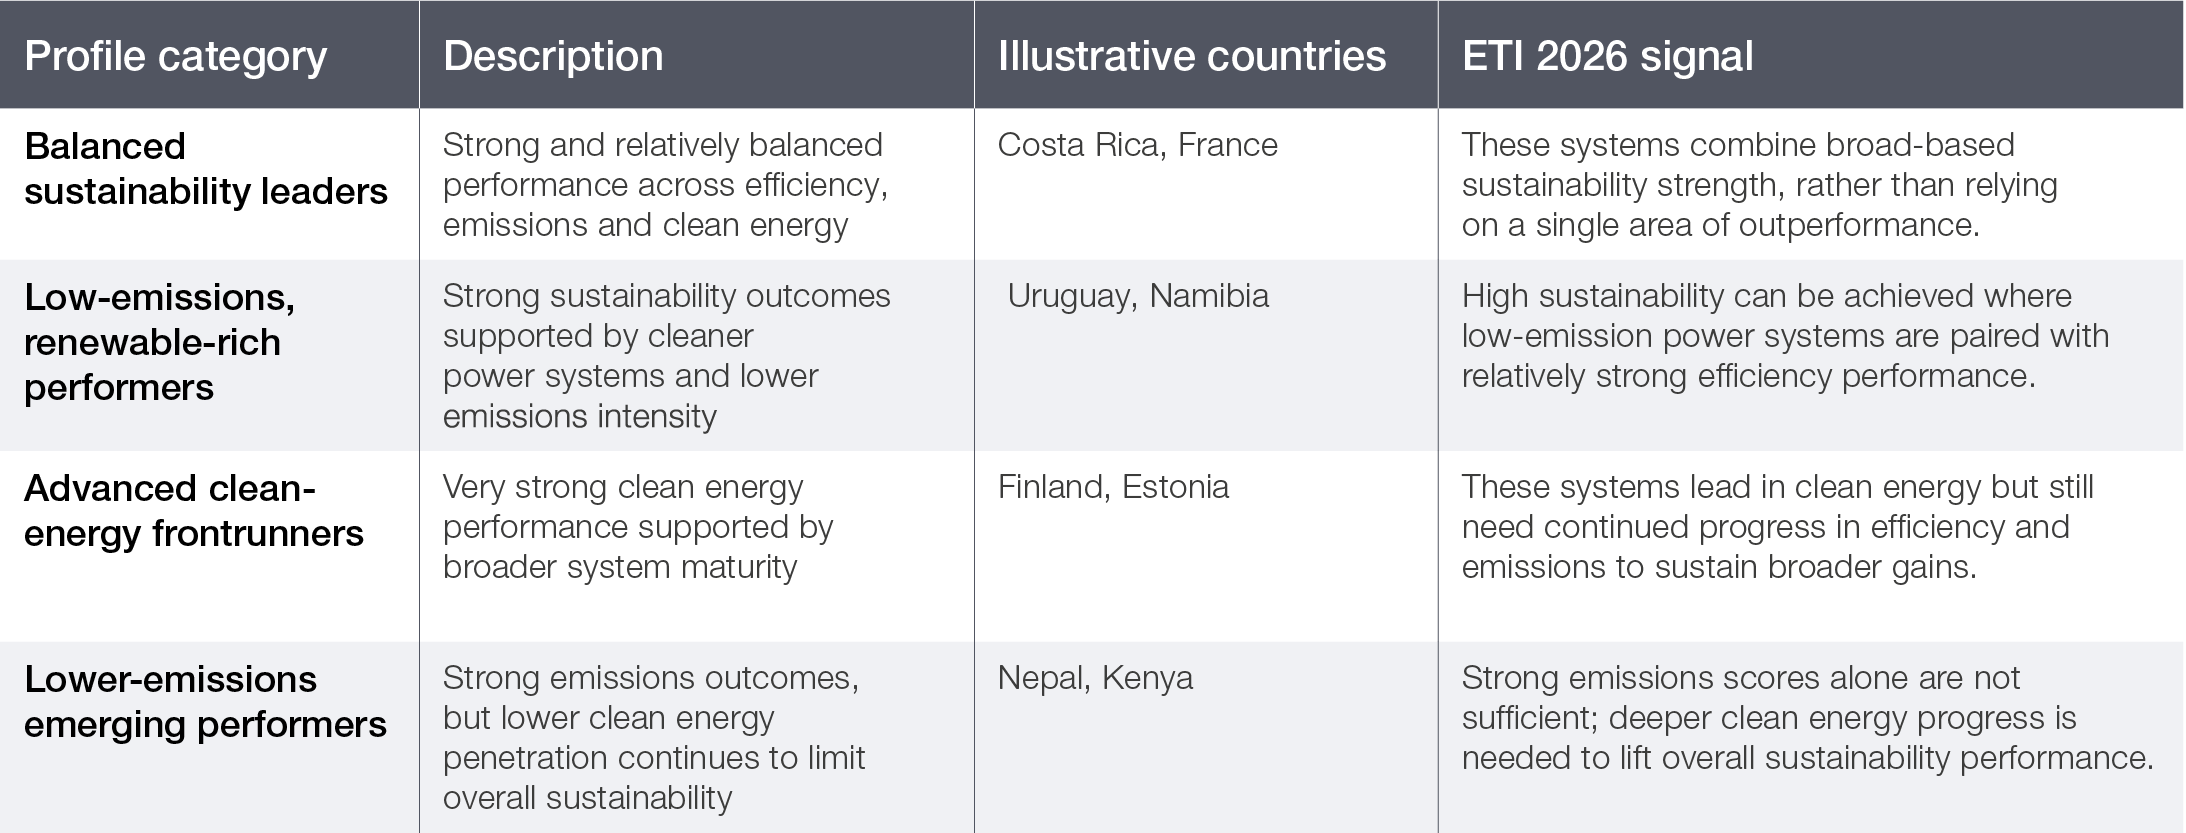

These profiles show that, even as clean energy deployment becomes more important, it is not the only determinant of strong performance. Countries can lead by prioritizing lower emissions, efficient energy use and cleaner electricity supply, but long-term leadership increasingly depends on progress across all of these areas.
3.2 Transition readiness
Box 8: Transition readiness key takeaways
- From the engine of growth to an emerging bottleneck. After a decade of steady gains, transition readiness has recorded its first decline – a fundamental shift in the structure of ETI progress.
- Core enablers weaken simultaneously. Declines in regulation and political commitment, financial investment and innovation signal a broad-based erosion of the conditions that make deployment possible at scale.
- A growing disconnect between capital and conditions. Investment is at record levels, but its momentum is slowing. Total clean energy investment reached $2.3 trillion, yet renewable energy investment fell by 9.5% as electrified transport overtook renewables as the largest category. This signals a structural rebalancing of transition capital.
- Regional divergence is deepening. Except for Sub-Saharan Africa and emerging Europe, transition readiness scores declined for all regions.
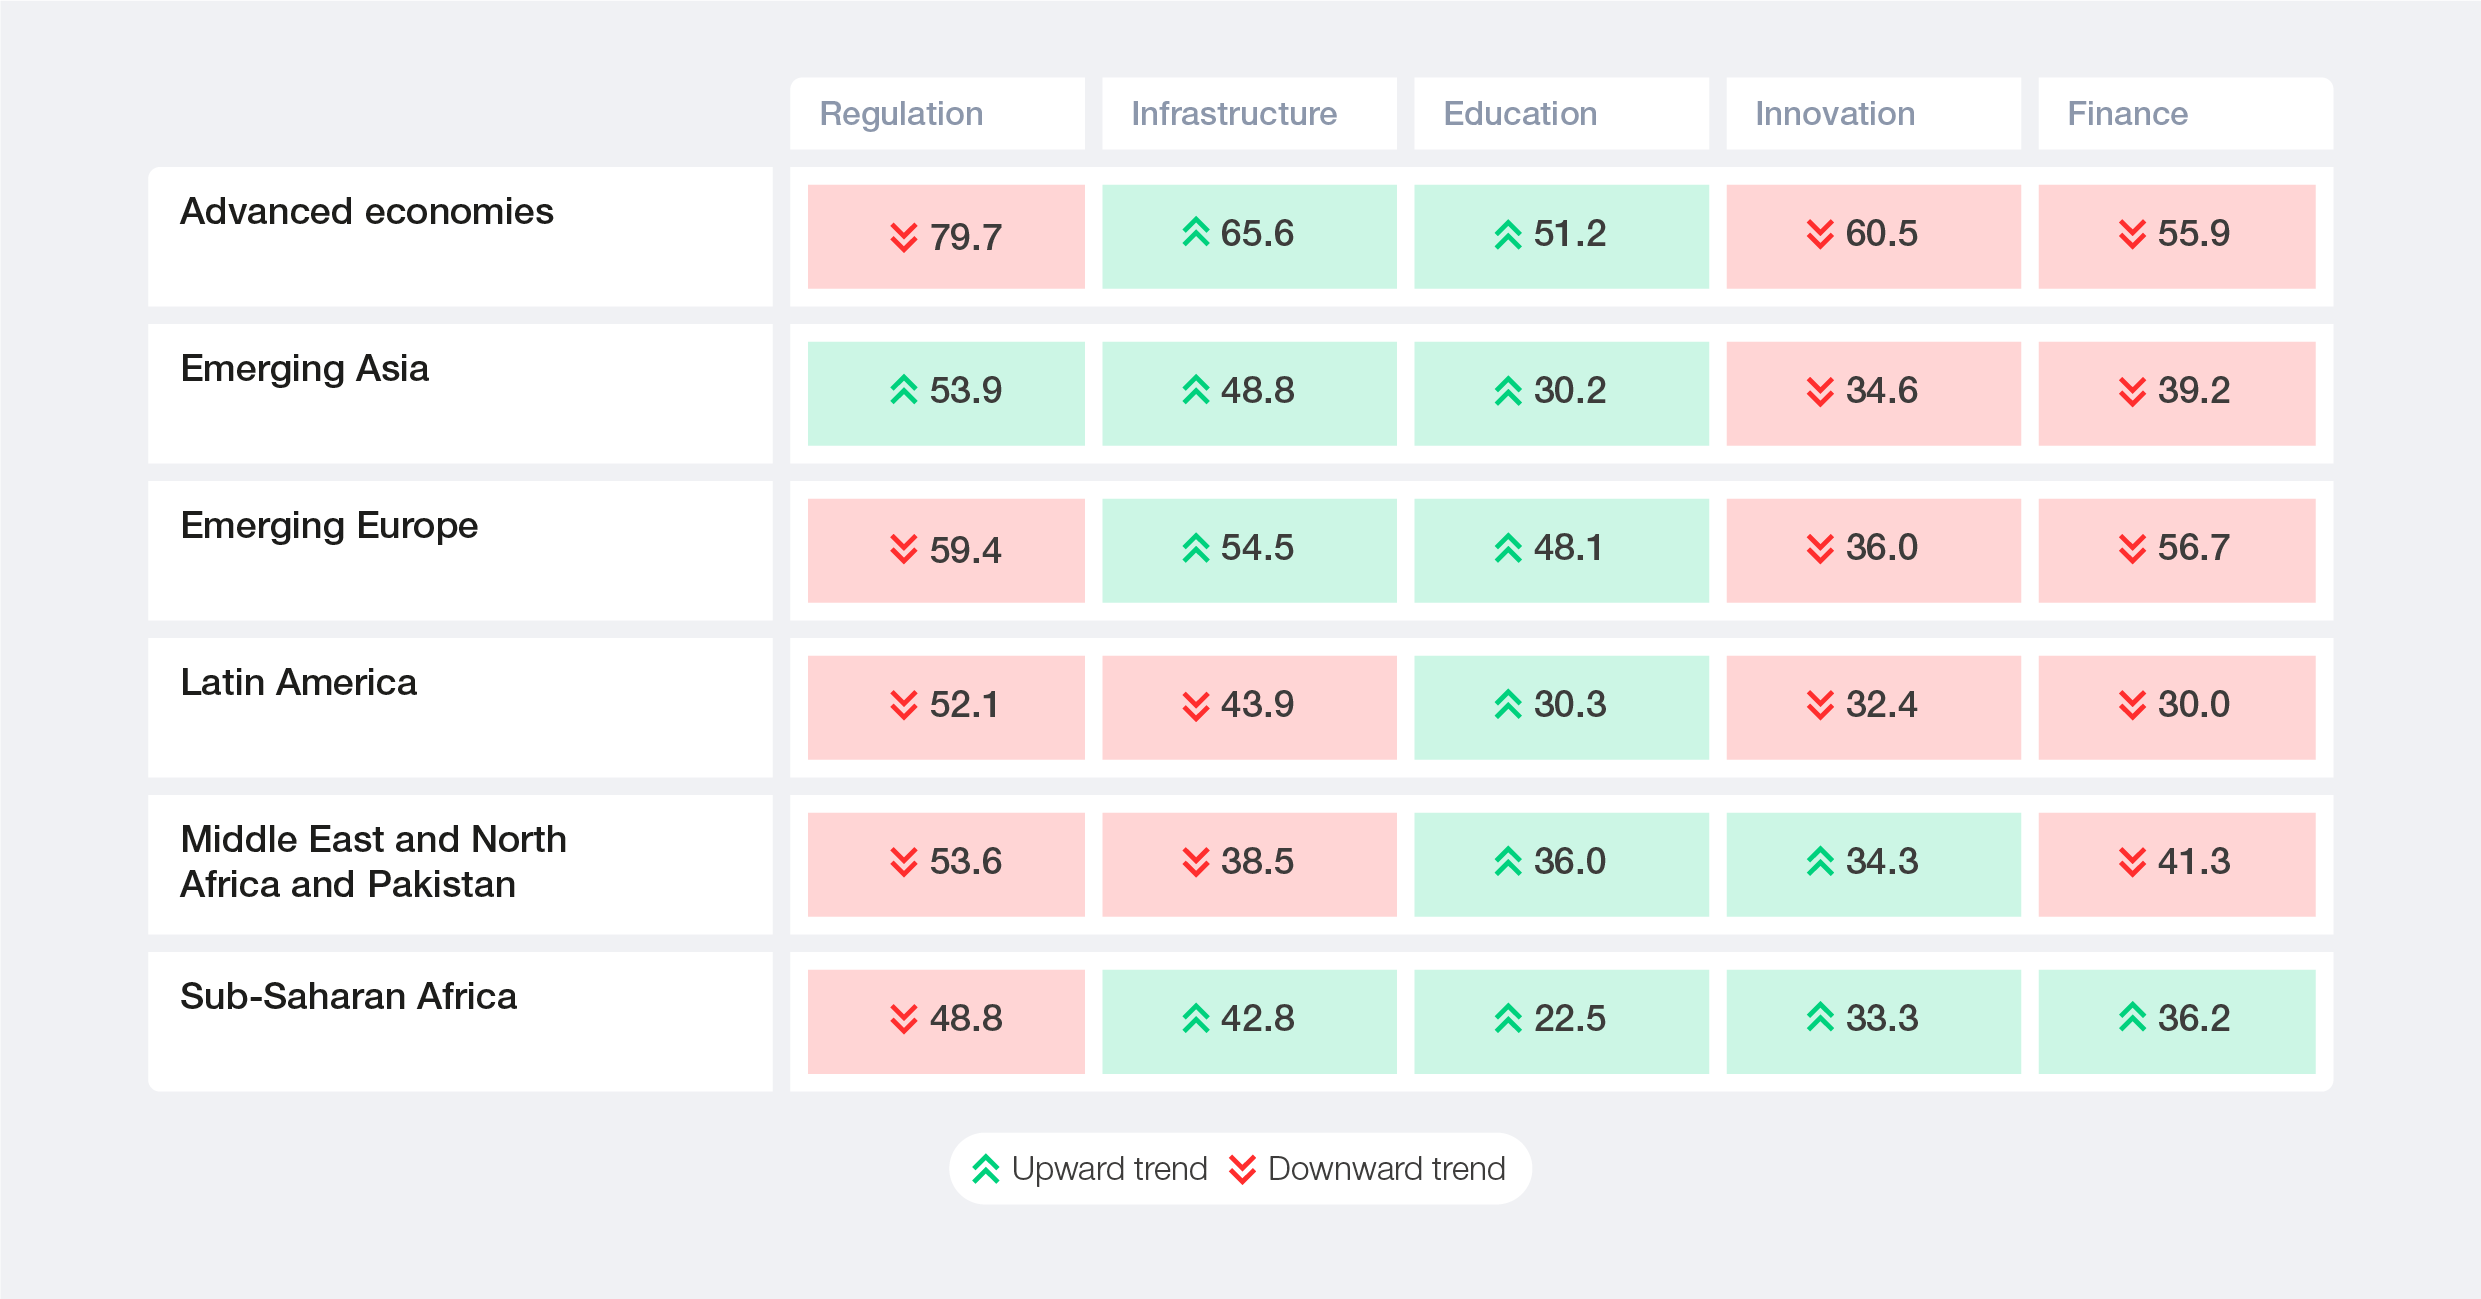
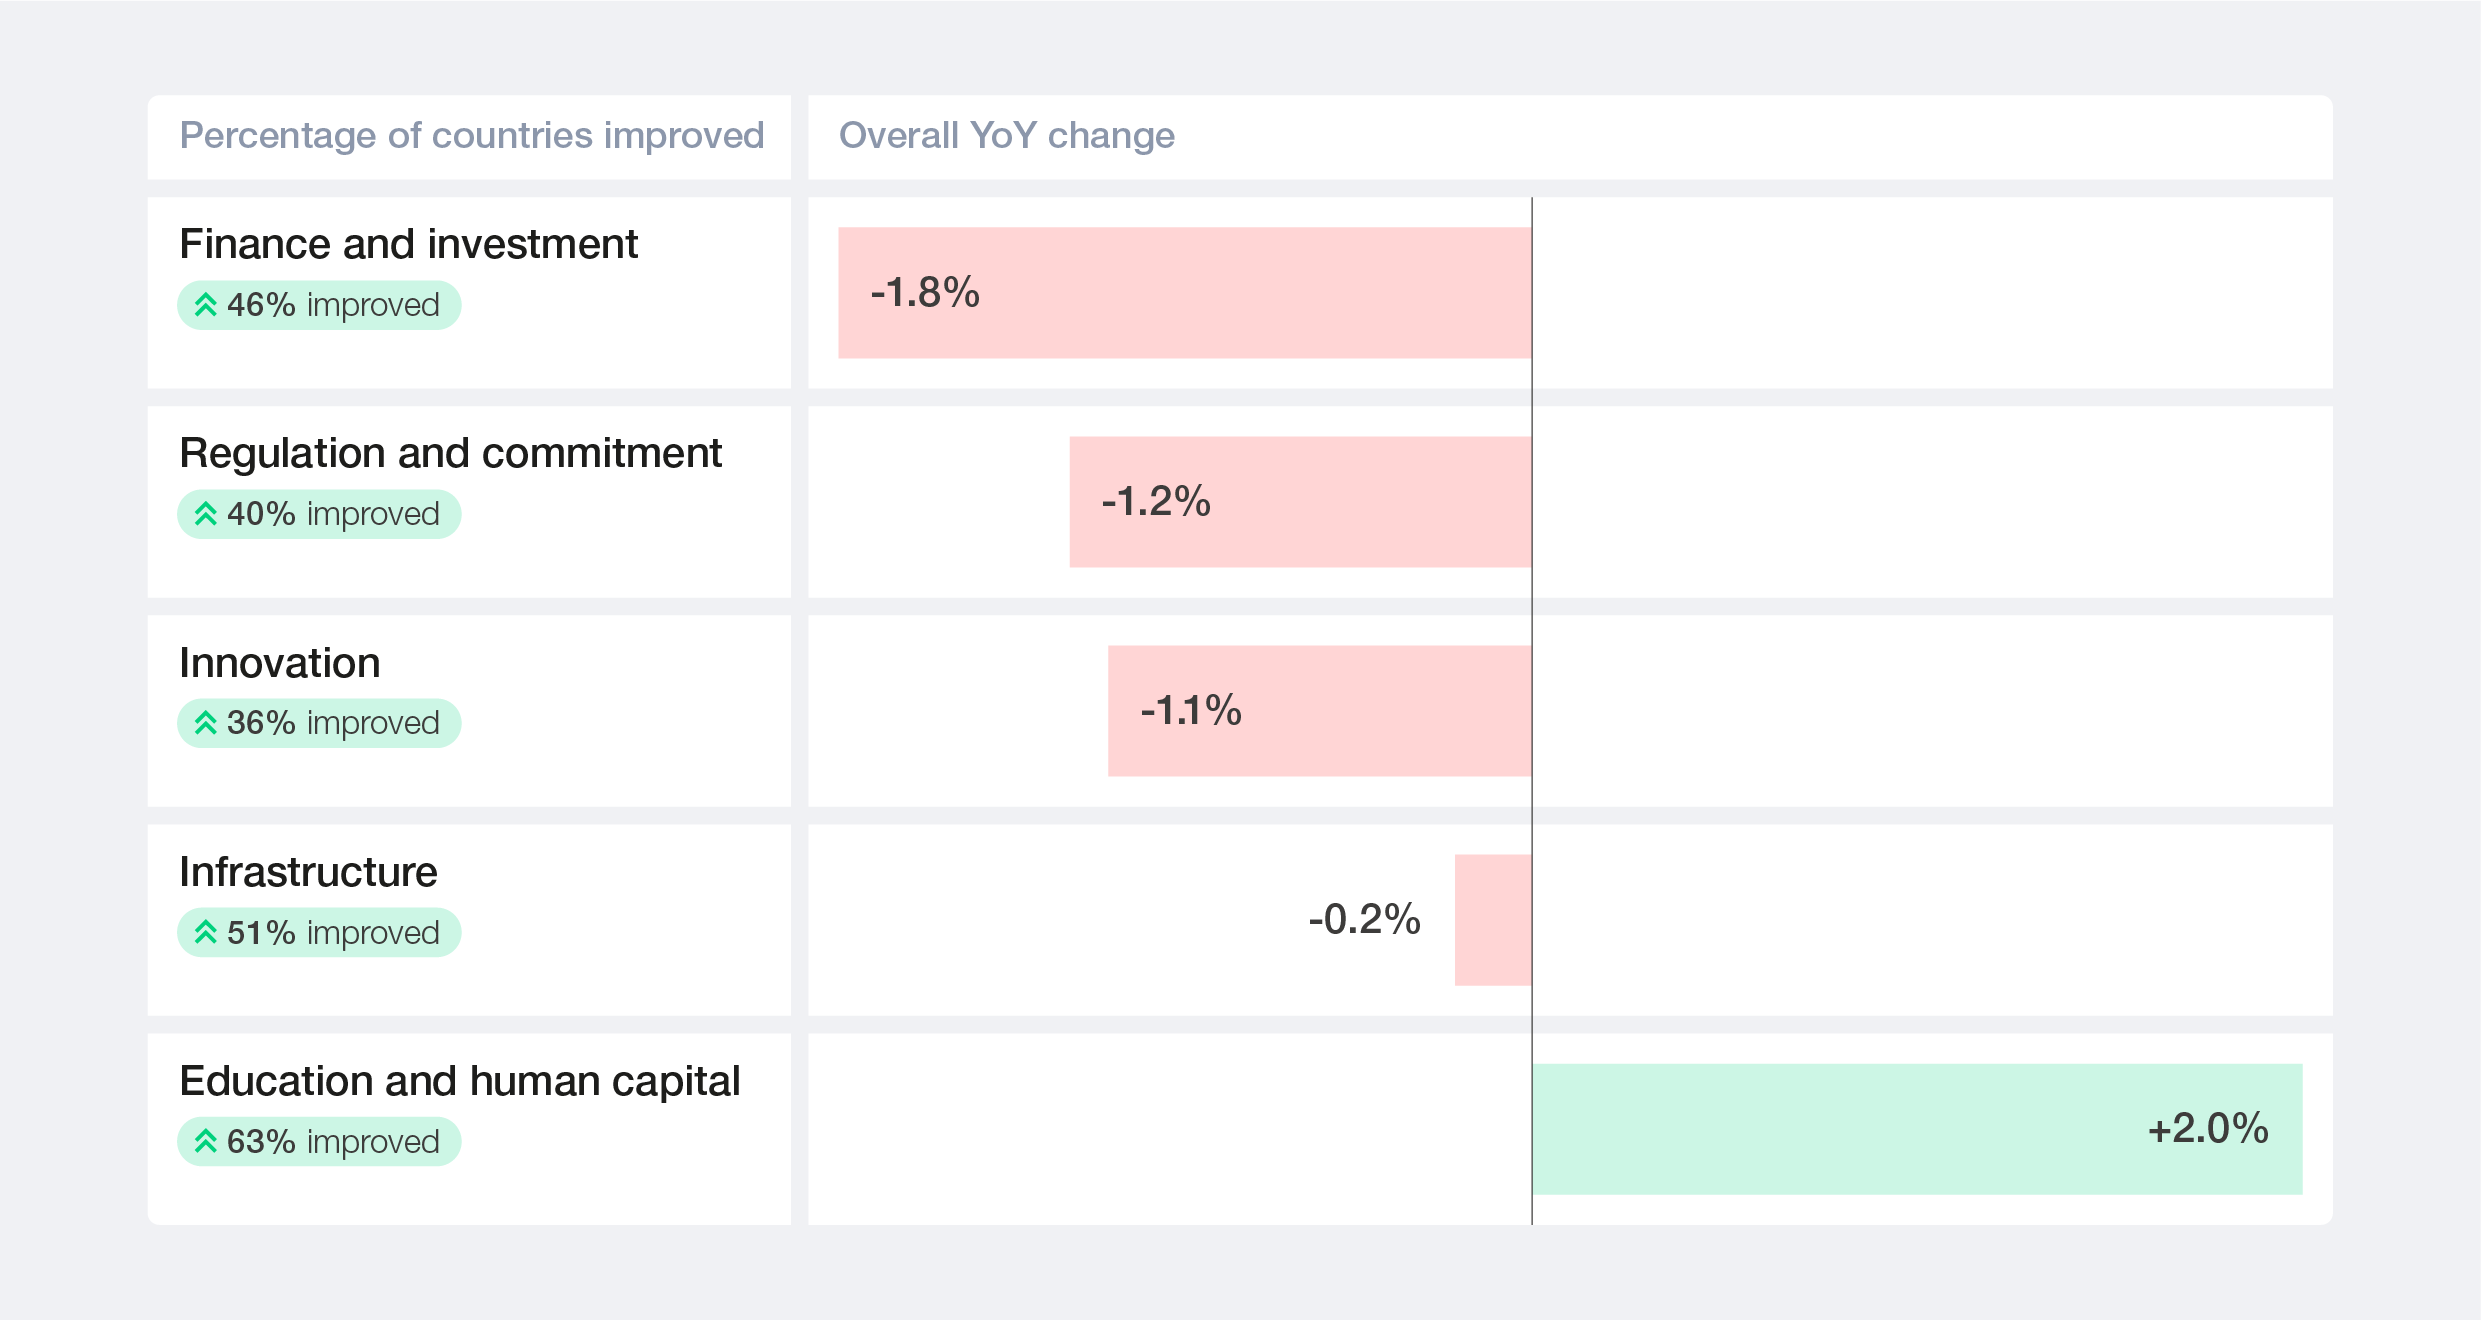
Figure 14: Transition readiness: first decline in a decade

The ETI’s transition readiness sub-index measures key factors for the energy transition, including policy stability, political commitment, investment climate, capital access, consumer involvement and technology adoption. These aspects determine how effectively a country can advance its energy transition. Elements such as skills and transport infrastructure, though broader than the energy system, are included because of their impact on transition success.
In this edition, the transition readiness sub-index has been enhanced by the inclusion of two new indicators. The first is AI readiness, which assesses how countries can harness AI to support and accelerate the energy transition. The second is clean technology mineral import exposure, which illustrates how well countries are positioned to develop the required infrastructure and secure critical supply chains that are essential for the transition.
Together, these enhancements provide a more comprehensive and forward-looking view of readiness, better reflecting emerging signals that will shape how energy transitions unfold.
After a decade of steady progress, transition readiness has recorded its first contraction. This is a meaningful structural signal; for most of the ETI’s history, readiness improvements in policy, investment, innovation and infrastructure have been the primary drivers of overall gains. A simultaneous decline across four of five readiness dimensions suggests this engine is stalling.
Figure 15: ETI transition readiness trend, 2017–2026
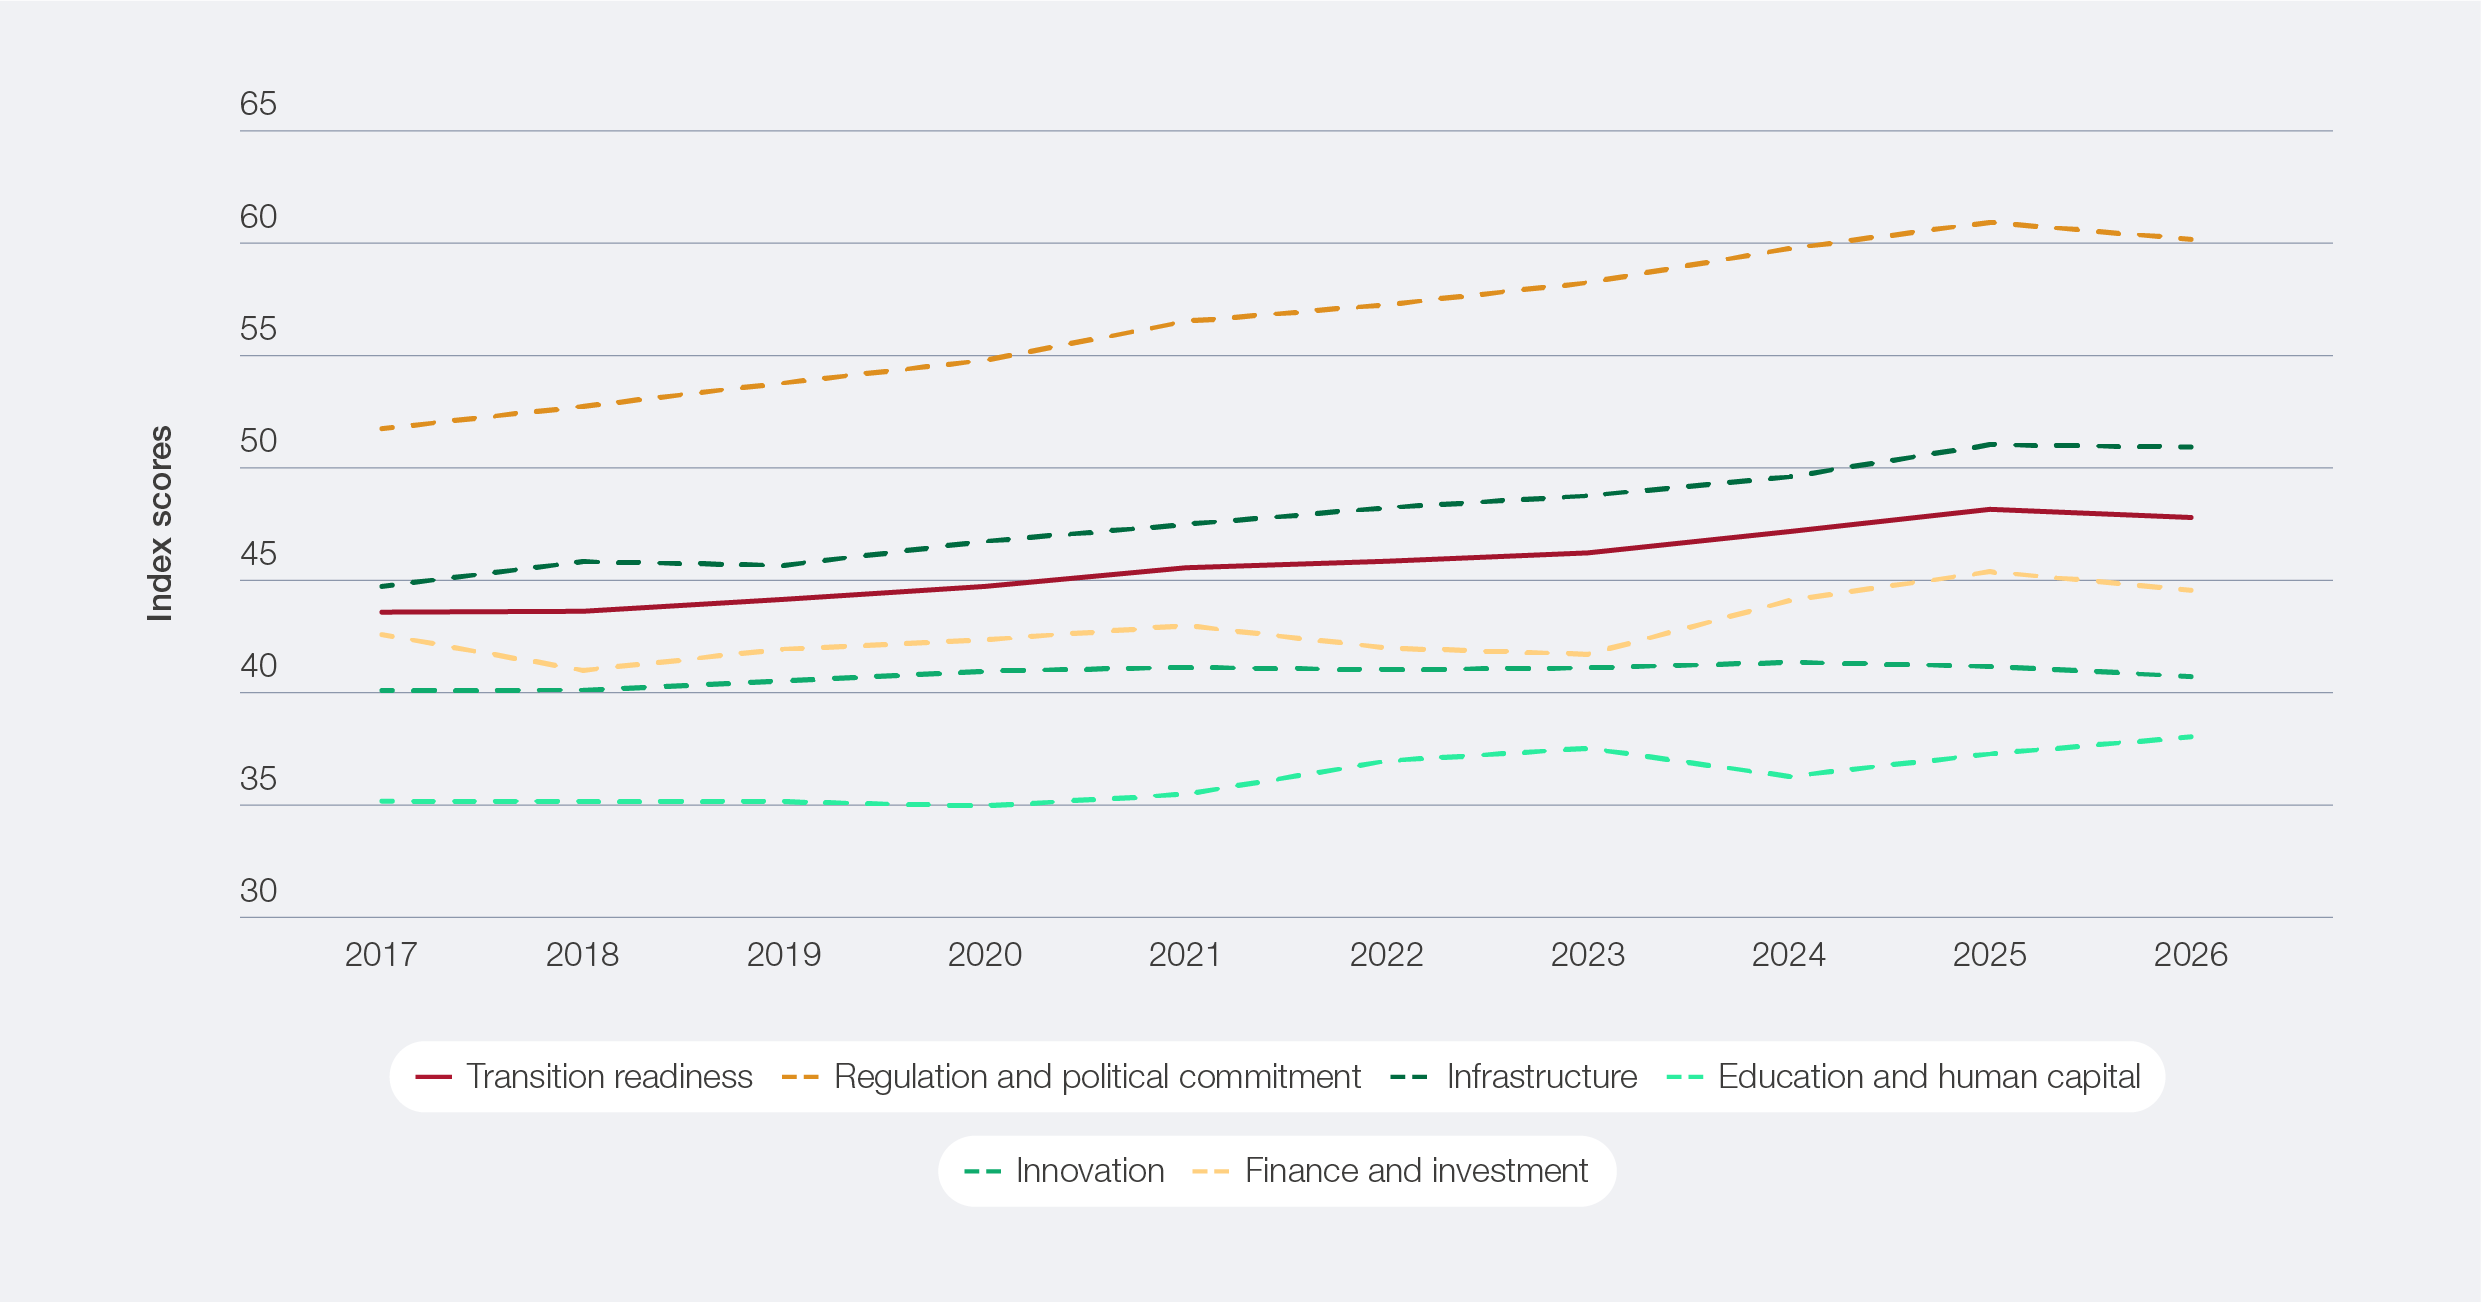

Figure 16: ETI transition readiness 10-year growth trend, 2017–2026
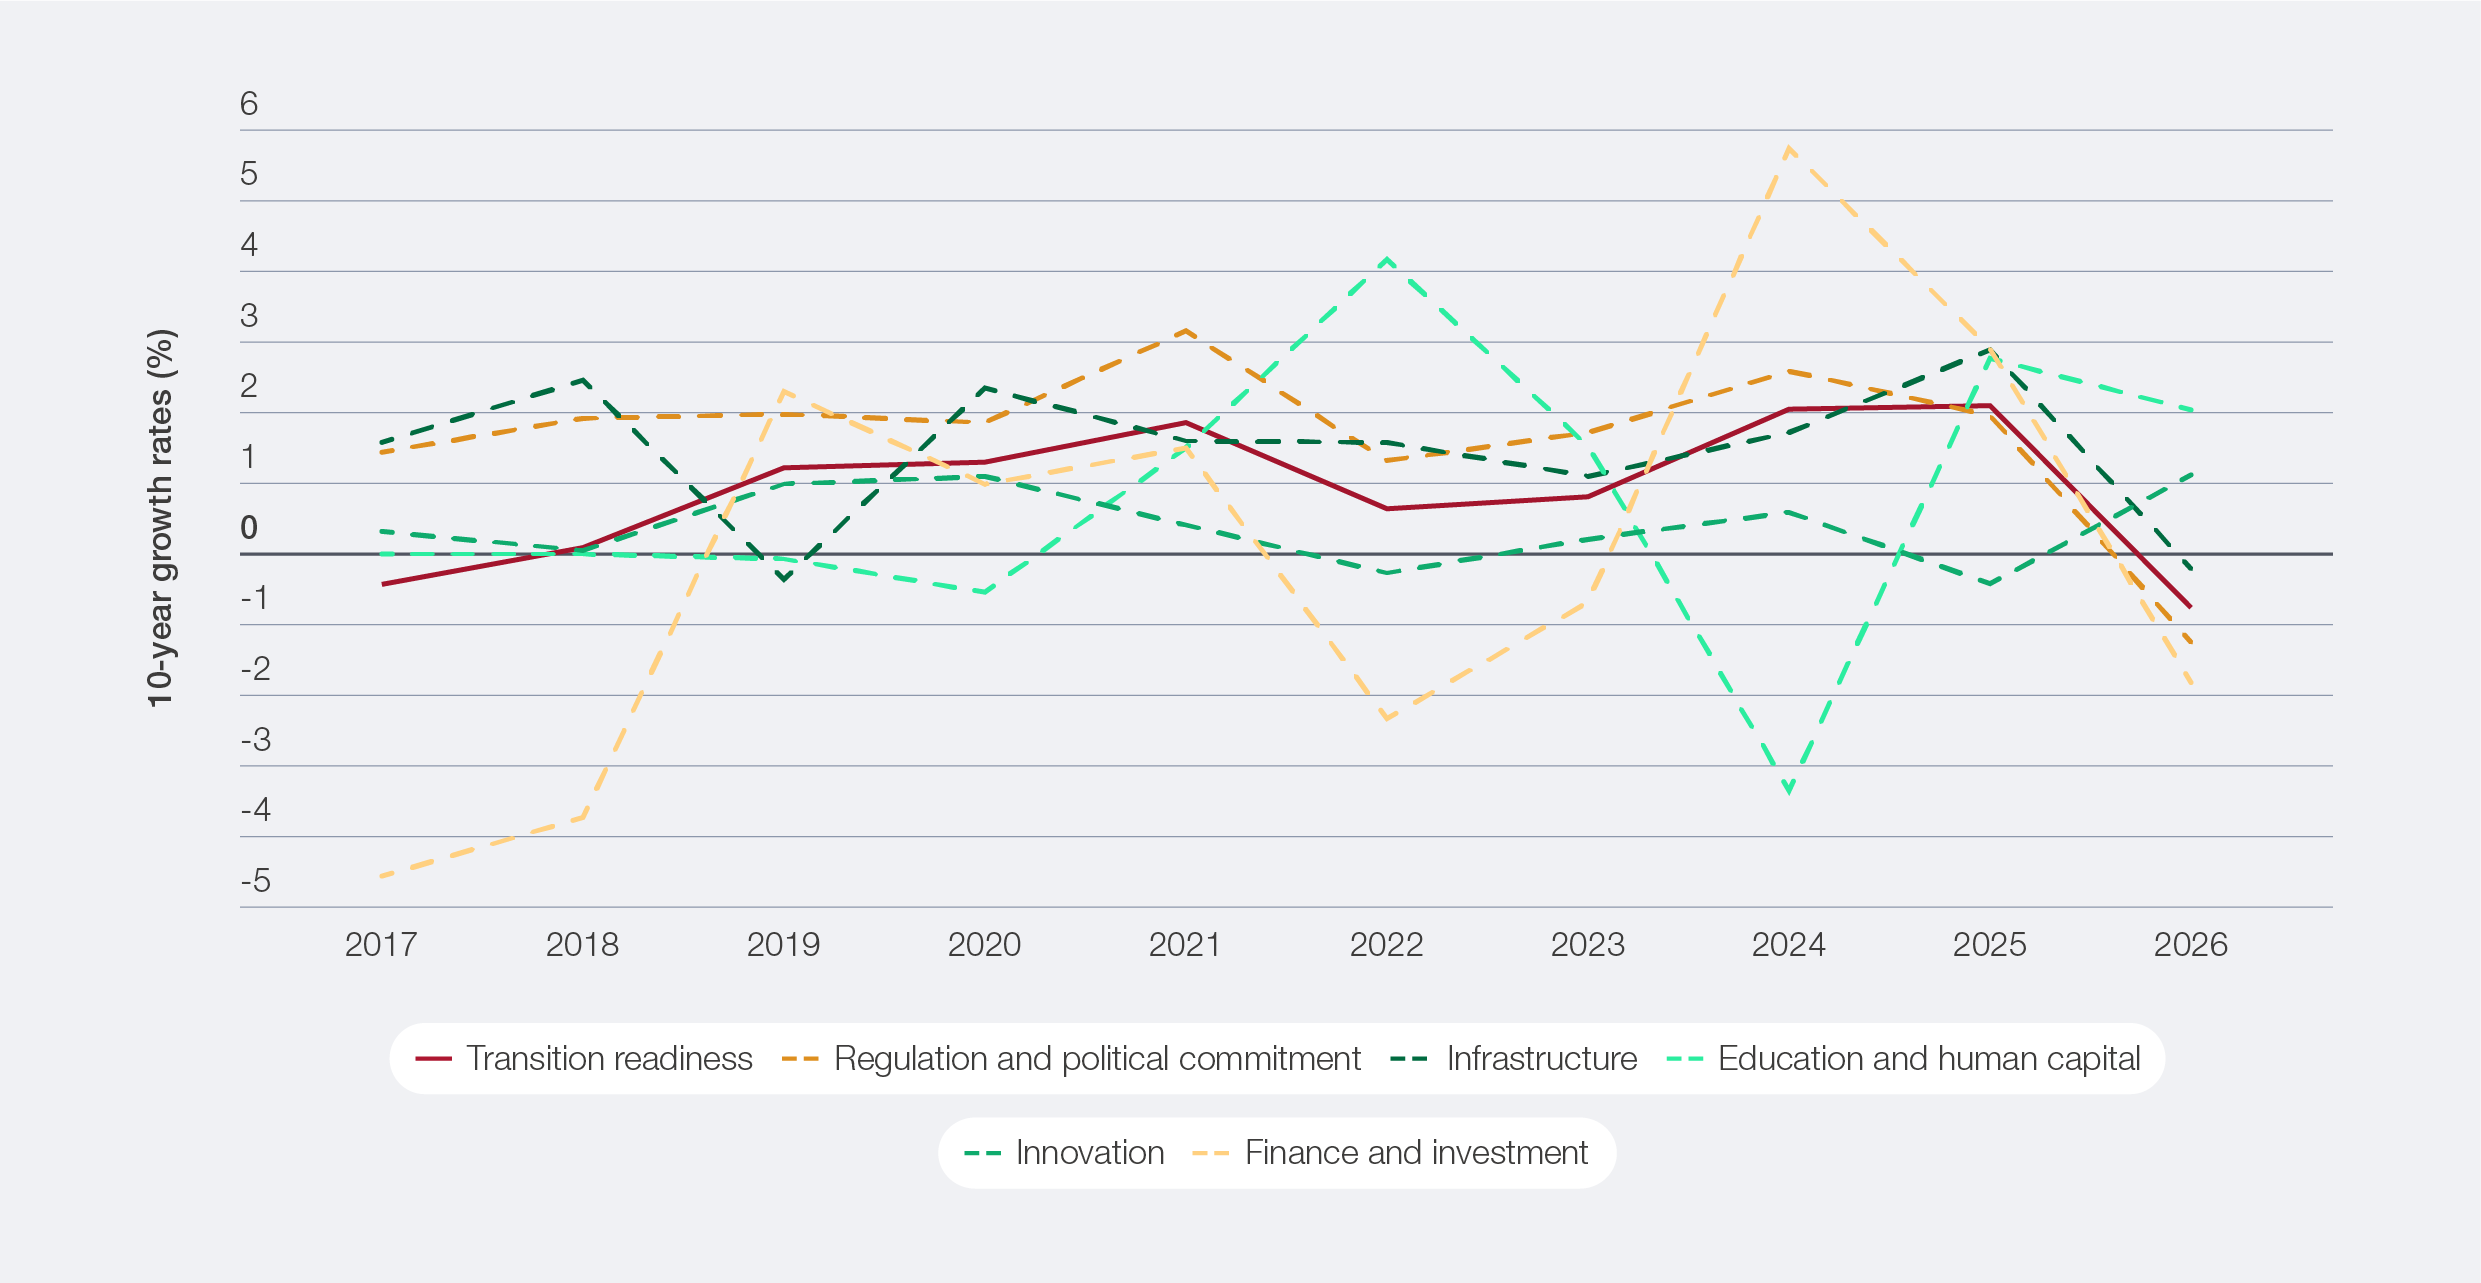

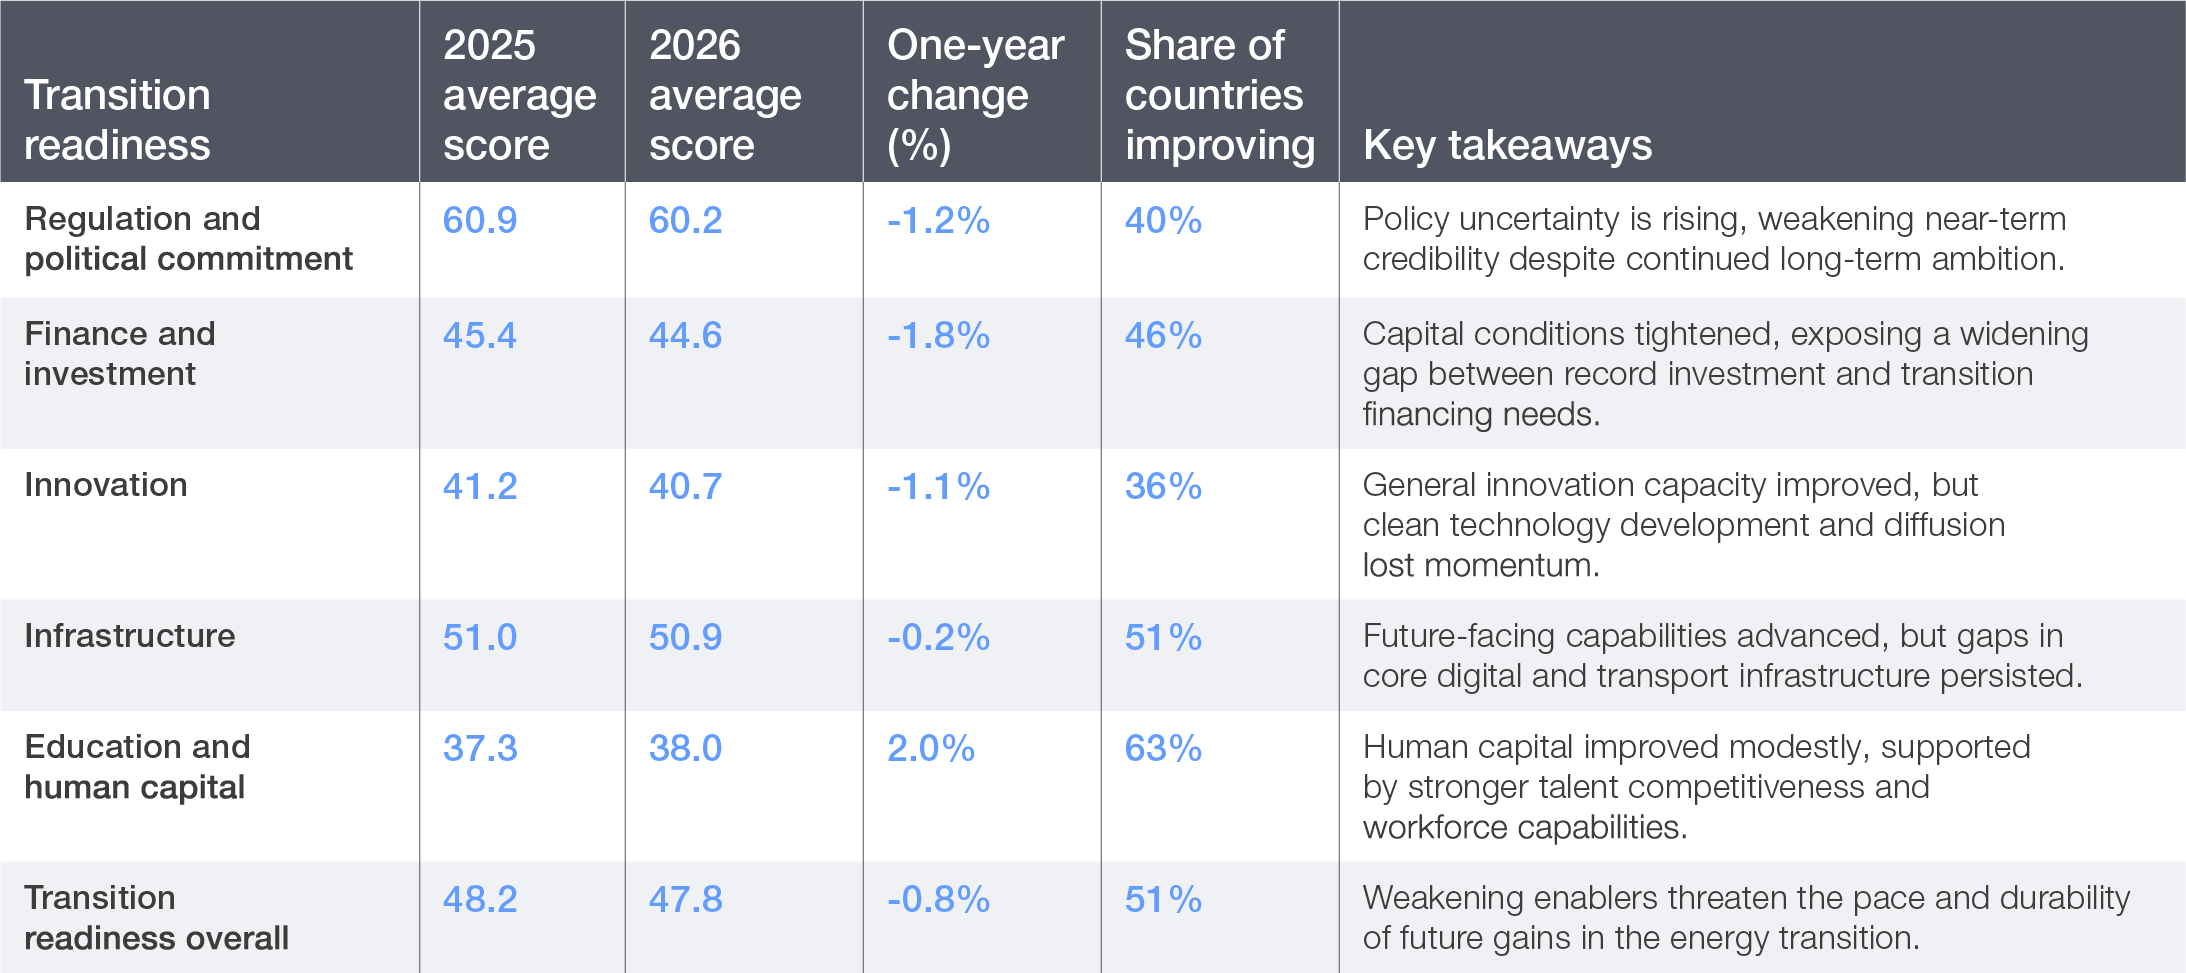
Table 8: Driving factors for 2026 decline in transition readiness

Erosion in transition readiness
The 2026 results confirm that the decline in transition readiness is not due to a single cause. Some of the deterioration reflects near-term macroeconomic pressures – elevated interest rates, fiscal tightening and short-term policy uncertainty – that are likely to ease as financial conditions normalize and policy cycles stabilize, reducing their drag on clean energy investment and readiness scores. However, the breadth and persistence of the decline across innovation, institutional delivery and investment pipeline depth point to structural erosion that will not self-correct.
The slowdown in regulation and political commitment (-1.2%) reflects a broad-based and consistent decline across six of its seven underlying indicators, most notably policy stability (-2.1%) and economic freedom (-1.6%). This pattern is visible across both advanced (Netherlands, United Kingdom, France) and emerging economies (Colombia, Armenia, Georgia). In 2025, several countries delayed or weakened updates to their Nationally Determined Contributions (NDCs), signalling slower near-term climate action and reduced international coordination. At the same time, policy realignments in major economies including the US have weakened policy clarity by prioritizing fossil fuel development. Similarly, several elements of the European Green Deal have been delayed, withdrawn or simplified, indicating that the gap between long-term ambition and near-term policy delivery is widening. However, the regulatory landscape is not uniformly weakening. In some areas, it is also becoming more enforceable and trade-relevant. For example, the EU Methane Regulation will require equivalent monitoring standards for energy imports from 2027 and introduce maximum methane intensity limits by 2030,72 making upstream emissions performance a factor in compliance, trade exposure and market access. Italy also updated its NECP in 2024, raising the renewable electricity target to 63.4% by 2030,73 and introduced streamlined permitting through designated “suitable areas” for renewables. India tightened renewable purchase obligations, expanded manufacturing incentives under the Production-Linked Incentives (PLI) scheme and mandated grid expansion through the Green Energy Corridor – anchored in energy security and industrial competitiveness. In both cases, the strengthening of regulations was tied to concrete instruments with implementation timelines, not ambition alone.
The drop in finance and investment (-1.8%) was the sharpest across all readiness enablers, yet it does not reflect a retreat from transition investment overall. The decline is driven primarily by a fall in renewable energy investment and weakening domestic credit conditions (both of which the ETI directly measures), even as broader clean energy spending reached new highs in categories such as electrified transport and grids. Total clean energy investment reached a record $2.3 trillion in 2025, up 8% YoY, though the pace of growth has slowed steadily from 27% in 2021 (11% in 2024), suggesting that while volumes continue to rise, momentum is moderating. Electrified transport ($893 billion) has overtaken renewables as the largest category, and grid spending ($483 billion) continued to rise. This reflects a natural broadening of transition capital as energy systems mature and the investment frontier shifts from generation towards delivery and electrification. The decline was concentrated in renewable energy investment, which fell 9.5% to $690 billion. This shift was driven largely by China, which, despite maintaining overall clean energy investment leadership (around $800 billion), recorded its first drop in renewable energy funding since 2013 as changing power market regulations introduced new uncertainties. In contrast, markets such as India (+15% to $68 billion) continued to expand.74 Moreover, declining domestic credit to the private sector reinforced this trend, suggesting that tighter liquidity and higher capital costs are further constraining the financial environment, particularly in emerging economies where the gap between capital needs and capital access is widening.
The decline in innovation (-1.1%) reflects a contrast between improvements in the broader enabling ecosystem and weakening market pull for clean technology. The innovative business environment and R&D intensity as a share of GDP have both improved modestly over the past decade. However, the diffusion of environment-related technologies – measured as the share of the global pool of inventions seeking patent protection in a given market – has declined by 29.2% over the past decade and a further 9.6% in 2026. This makes it the primary driver of the innovation score’s near-flat 10-year trajectory. The pattern is visible across a broad set of countries, including Croatia, Uruguay, Viet Nam, Costa Rica, Namibia, Jordan and Serbia, suggesting that the weakening market signal for clean technology commercialization is widespread. The global clean technology pipeline continues to grow, with energy technology patents rising steadily over the past decade, driven by strong growth in solar, wind (which more than doubled between 2008 and 2023) and related fields.75 The challenge is not a shortage of innovation but its diffusion: fewer markets are attracting inventions at the pace needed to sustain the next phase of the transition. For technologies still maturing, including long-duration storage, industrial decarbonization and advanced grid systems, this raises concerns about whether sufficient market pull and R&D support will be available to bring them to commercial scale. For the many solutions that are already proven, the more pressing challenge is deploying them widely, supported by market structures, regulatory frameworks and financing conditions that reward adoption at pace.
Infrastructure also recorded a slight decline (-0.2%). Although it was not a primary driver of the overall drop in transition readiness, it did reveal an important shift in the nature of readiness. The 2026 ETI expands this sub-dimension through two new indicators: AI readiness and clean tech minerals import exposure, broadening the assessment of future-facing transition capabilities. Performance in critical minerals was strongest in countries such as China, South Africa, Australia, Indonesia, Chile, Canada, the US and Brazil, while AI readiness aligned with established technology leaders, including the US, France, the United Kingdom, China and the Netherlands. However, these gains were offset by weaker performance in digital (-1.0%) and transport (-1.1%) infrastructure, with declines seen across both advanced and emerging economies. This is due to higher borrowing costs, declining domestic credit and slowing investment momentum, which are affecting the pace of infrastructure development globally. Furthermore, the widespread diffusion of clean tech is increasingly constrained by supply chain vulnerabilities. Strengthening the resilience of critical mineral trade flows is now a prerequisite for translating general innovation into scalable green infrastructure. This suggests that, while countries are building new strategic capabilities, foundational infrastructure is improving more slowly.
Education and human capital was the only transition readiness enabler to improve (2.0% YoY), mainly due to higher global talent competitiveness (5.4%) and growth in jobs in clean tech (2.5%). Biofuels represent a particularly significant source of clean-sector employment, especially in agricultural and rural economies, where they combine decarbonization with broad-based job creation and economic inclusion. The ETI observed progress across a diverse group of countries, including Algeria, Brazil, Cameroon, Ghana, Panama, Israel, Kyrgyzstan, Oman and Pakistan, likely driven by continued recovery in labour markets, increased investment in skills development and education, and a focus on building human capital for economic resilience. These gains remain modest, but they stand in contrast to the broader slowdown across other enablers.
The results of the 2026 ETI point to a clear shift in the dynamics of the energy transition. The recent COP30 outcome, which announced a $1.3 trillion climate finance pledge without fossil-fuel phase-out language, represents a mixed signal that reinforces the readiness warning. Restoring readiness momentum will require both near-term stabilization of the enabling environment and longer-term rebuilding of the foundational conditions – innovation capacity, institutional credibility and diversified capital access – that the transition depends on at scale.
Diverging regional pathways in transition readiness
2026 marks a clear inflection point, with readiness slowing or declining across most regions. This shift highlights growing divergence not only in performance levels but in the underlying capacity to sustain progress.
Advanced economies (-0.67% YoY) saw a modest decline in transition readiness, primarily driven by weakening finance and investment (-3.0%), innovation (-1.6%) and regulatory commitments (-0.7%). Despite maintaining strong institutional frameworks, these economies are increasingly facing constraints linked to tighter financial conditions, policy fatigue and slower innovation diffusion. At the same time, the decline in clean energy infrastructure reflects a combination of maturity effects and emerging system constraints (grid capacity bottlenecks, permitting delays and variable renewable integration). This is occurring despite continued growth in investment, with the European Union increasing clean energy investment by 18% to $455 billion and the US by 3.5% to $378 billion in 2025,76 underscoring a disconnect between capital deployment and improvements in enabling conditions. Gains in education and human capital were not sufficient to offset these pressures, signalling an inflection point in readiness in mature systems.
Emerging Asia (-1.0% YoY) recorded a notable slowdown. The decline was driven by sharp contractions in finance and investment (-7.7%) and innovation (-3.4%). The region continues to benefit from relatively strong regulatory frameworks and long-term gains in clean energy deployment, infrastructure expansion and energy access. However, recent volatility has begun to weigh on investment flows and overall readiness. More broadly, Asia remained the largest destination for clean energy investment globally, primarily driven by China, highlighting its continued centrality to the global transition.
Emerging Europe (0.06% YoY) remained largely flat, reflecting a mixed trajectory. Continued improvements in education and human capital (2.0%) and infrastructure (0.2%) were offset by persistent declines in innovation (-1.0%), finance and investment (-0.3%) and regulatory performance (-0.3%). The region has made steady gains over the past decade, yet structural gaps, particularly in innovation capacity and financial investments, continue to constrain stronger progress.
Latin America and the Caribbean (-2.5% YoY) recorded one of the sharpest regional declines, driven by contractions across infrastructure (-6.1%), regulation (-2.3%), innovation (-3.0%) and finance and investment (-1.2%). Declines in infrastructure in countries such as Uruguay, Costa Rica, Peru and El Salvador reflect a combination of high baseline performance in energy systems, particularly in renewables, and slower momentum in transport and digital infrastructure investment, compounded by tighter fiscal and financing conditions. More broadly, structural challenges in investment mobilization, policy stability and infrastructure delivery continue to weigh on readiness across the region.
Middle East, North Africa and Pakistan (-1.8 YoY) also saw a notable decline, with sharp drops in regulation and political commitment (-3.8%) and infrastructure (-2.4%) outweighing gains in education and innovation. Declines in countries such as Tunisia, Jordan, Lebanon, Egypt and Pakistan largely reflect macroeconomic pressures, institutional constraints and delays in policy implementation rather than a reversal of long-term ambitions. In several cases, fiscal stress and energy security concerns have slowed reform momentum and weakened policy consistency, highlighting a growing gap between stated targets and execution.
Sub-Saharan Africa (3.3% YoY) stands out as the only region showing strong improvement, driven by gains across multiple enablers, particularly finance and investment (8.6%), education (5.6%) and innovation (5.0%). Despite starting from a lower base, this progress reflects increasing momentum in capital inflows, innovation activity and human capital development. However, persistent challenges in infrastructure and regulatory frameworks point to an uneven but gradually improving readiness landscape.
The global context for the energy transition is becoming increasingly complex, shaped by geopolitical tensions, shifting trade dynamics and tighter economic conditions as countries rebalance priorities. After a decade of steady gains, transition readiness is beginning to slow, reflecting growing pressures across key enablers, primarily investments and regulation. At the same time, evolving dynamics are redefining readiness itself, with greater emphasis on technological capability and supply chain resilience. Going forward, sustaining progress will depend on countries’ ability to navigate complexity and adapt to an increasingly uncertain environment – treating current pressures as catalysts for building more resilient and innovative energy systems.
Figure 17: Transition readiness pulse check by region