The Global Cooperation Barometer 2026 – Third Edition

About the Global Cooperation Barometer
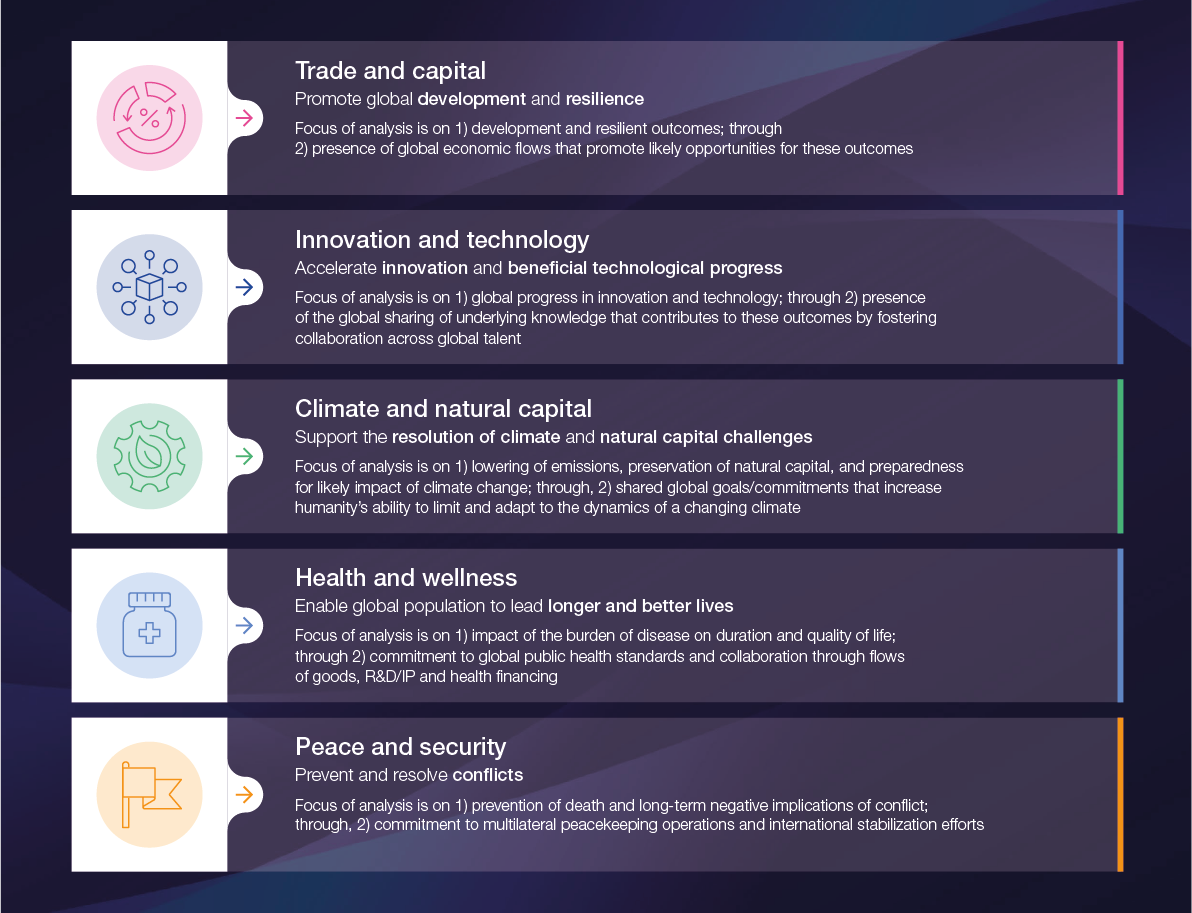
The Global Cooperation Barometer is structured along five dimensions of global connection: trade and capital, innovation and technology, climate and natural capital, health and wellness, and peace and security.
These five pillars were chosen because of their impact on global development and their explicit dependence on cooperative efforts among nations and economies. As a guiding element in the analysis, the barometer identified goals that actors are working towards in each of these themes. In doing so, the barometer draws inspiration from the United Nations Sustainable Development Goals (SDGs) and the efforts of other global institutions.
To quantify change in these pillars, 41 indicators were identified that research suggests are either cooperative actions that advance progress towards the goals of the pillars or demonstrate a broad outcome from those actions. Cooperative action metrics measure actions that provide evidence of cooperation; these indicators (such as flows of goods and exchange of intellectual property) are evidence of real, manifested cooperation and do not include “on paper” commitments. Outcome metrics (such as life expectancy) measure the progress of cooperation but are typically influenced by additional factors beyond cooperation.
The metrics span countries in all geographies and at all levels of development. The barometer examines the period from 2012 to 2024 to establish a trend line of cooperation. It indexes data to 2020 for the following reason: as the COVID-19 pandemic (hereafter referred to as “the pandemic”) took hold, it accelerated many existing trends in business and society and set many new ones in motion. Indexing the time series to 2020 highlights the trends in place before the pandemic and those that emerged from it. Note that some metrics have been inverted so that any increase represents a positive development. Though this tool is imperfect and necessarily incomplete, it offers an overview of global cooperation that both captures broad trends and identifies important nuances.
This year’s report includes the results of two surveys. The Global Cooperation Barometer survey collected responses from 1 September to 26 September 2025 from the World Economic Forum’s Network of Global Future Councils through a Qualtrics electronic platform. Current members of the network (those who are part of the 2025–2026 term) and those who served on a council during the previous term (2023–2024) received a link to take part in the survey. Out of a total of 224 responses received, 171 were used based on completeness. A second survey was conducted online using McKinsey’s proprietary global survey panel of industry executives and was in the field from 27 August to 5 September 2025. It garnered responses from 799 participants in 81 economies representing the full range of regions, industries, company sizes, functional specialities and tenures.
The methodology used for the metrics of the Global Cooperation Barometer is below. Details on the sourcing of individual metrics are in the Appendix.
Data coverage
Geography: Across all metrics, the barometer aims to collect global data. In most cases, an aggregate global weighted average is available. When a global weighted average is not available, the most comprehensive data is used – such as Organisation for Economic Co-operation and Development (OECD) member countries, or a sample set of countries where data is available for all years.
Years: While the barometer measures cooperation from 2012 through 2024, some metrics do not have data for all years. All metrics have 2020 data to ensure the indexed trendline can be calculated.
Index calculation
To evaluate global cooperation fairly and compare trendlines of the action and outcome metrics across the five pillars, the Global Cooperation Barometer applies the following methodology:
– Indexed trendlines
Data from 2020 serves as the base year to develop comparable trendlines, with all values in 2020 equal to one (2020 = 1). This base year standardization is the basis of the score calculation, enabling a uniform reference point for all metrics and comparability, despite different units and datasets.
– Data normalization
Where possible, metrics are normalized to ensure that trendlines can be assessed independently of the effects of economic growth or population changes. For example, trade, capital and other financial flows are normalized to global GDP (gross domestic product) while migration metrics are normalized to global population levels.
– Weighting
Each pillar comprises two indices: an action index and an outcome index. To arrive at each, the metrics within are weighted equally (i.e. the action index is a simple average of metrics measuring cooperative actions). The overall index for a pillar is calculated as an average of the action and outcome metrics. Aggregate indices across pillars are also calculated as a simple average of pillar indices (i.e. equal weighting across pillars).
A note on the analytical approach
In line with previous editions of the Global Cooperation Barometer, this edition uses data from two years prior to publication, as it is the most recent year for which comprehensive data are available. Given rapid developments across all the areas the barometer covers, this year’s report complements the 2024 findings with more recent 2025 data where available, through partial-year data or projections.
Figure 1: The Global Cooperation Barometer's five pillars of global cooperation