
Cross-sector findings
Note: This page presents Chapter 3 of the report. To view the chapter in the PDF with enhanced layout and presentation, please click download the full report using the link below.
Click here to download the Cross-sector findings of the Net-Zero Industry Tracker 2024 →
The sectors in scope last year have made progress in emissions reduction, but improvement in sector readiness scores has been limited.
3.1 Performance
Current emissions
The eight hard-to-abate sectors in scope collectively contribute to around 40% of direct CO2 equivalent (CO2e) emissions. This includes five heavy industry sectors (steel, cement, aluminium, primary chemicals, and oil and gas) and three heavy transport sectors (aviation, shipping and trucking).
Emissions historical trend
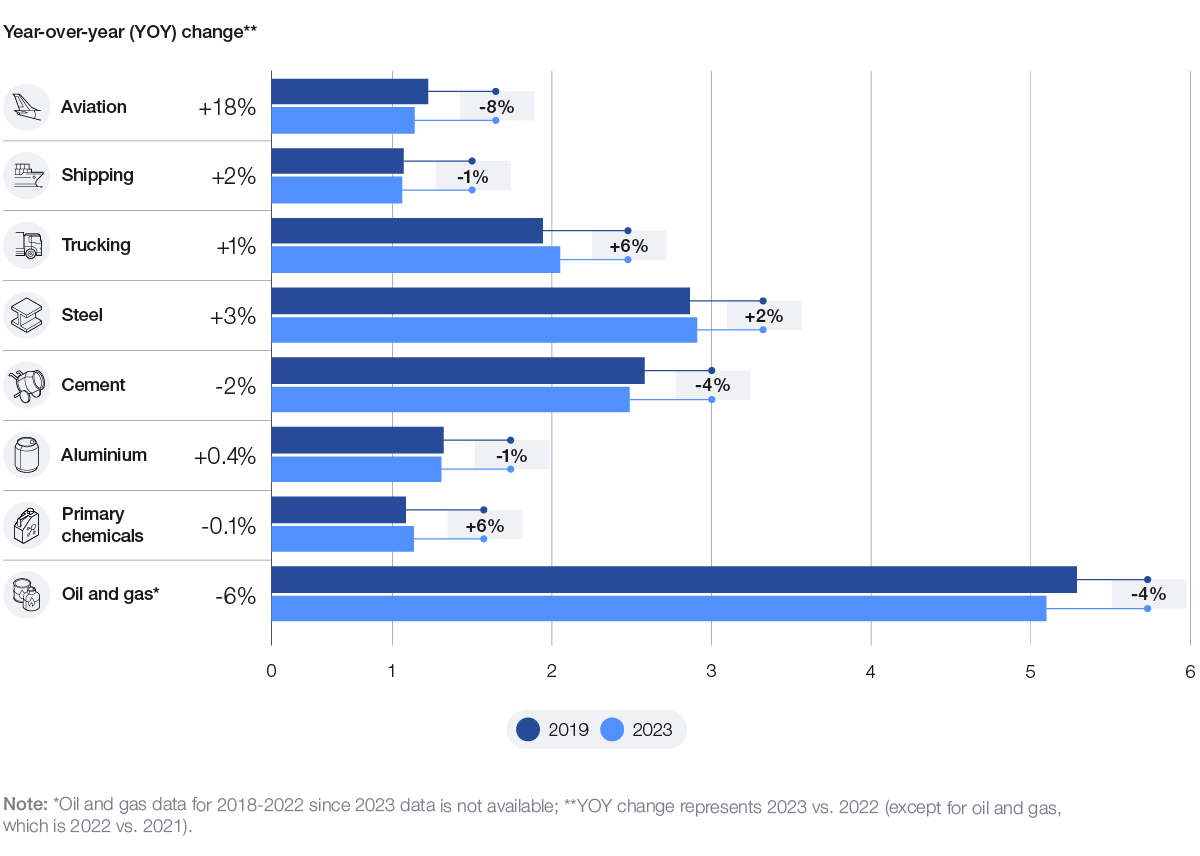
From 2019 to 2023, the total direct CO2e emissions for the sectors in scope decreased by 1.2%. The decline in emissions was mainly driven by aviation, cement, and oil and gas, and was partially offset by an increase in emissions in trucking and chemicals. Trucking saw the highest increase of 6.2%,19 while aviation emissions declined the most, with a reduction of 8.4%.20
More recently, from 2022 to 2023, the total absolute direct CO2e emissions for the sectors in scope decreased by 0.9%. This decline in emissions was mainly driven by oil and gas and cement, and was partially offset by the increase in emissions in aviation, steel and shipping. Aviation saw the highest increase of 17.6%,21 while oil and gas emissions declined the most, with a reduction of 6.4%.22
Figure 5: 2019 vs. 2023 absolute direct CO2e emissions by sector in gigatonnes (Gt) CO2e
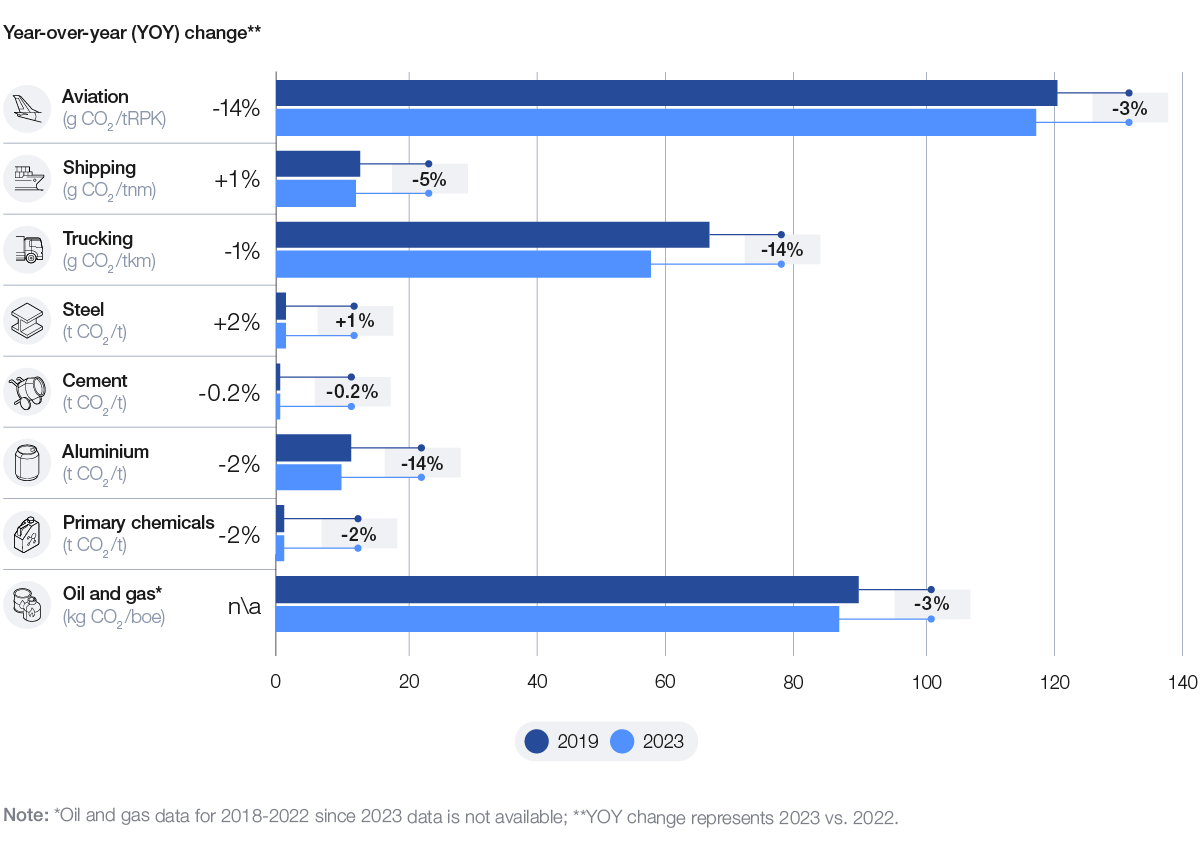
From 2019 to 2023, the sectors in scope saw a 4.1% decline in emissions intensity on average. All sectors (except steel) saw a decrease in emissions intensity in this period, with the highest drop of 13.7%23 seen in trucking, closely followed by a 13.6%24 drop in aluminium.
More recently, from 2022 to 2023, the sectors in scope saw a 1.2% decline in emissions intensity on average. All sectors except steel and shipping saw a decrease in emissions intensity in this period, with the highest drop of 14.1%25 seen in aviation.
Figure 6: 2019 vs. 2023 emissions intensity by sector
Industry output
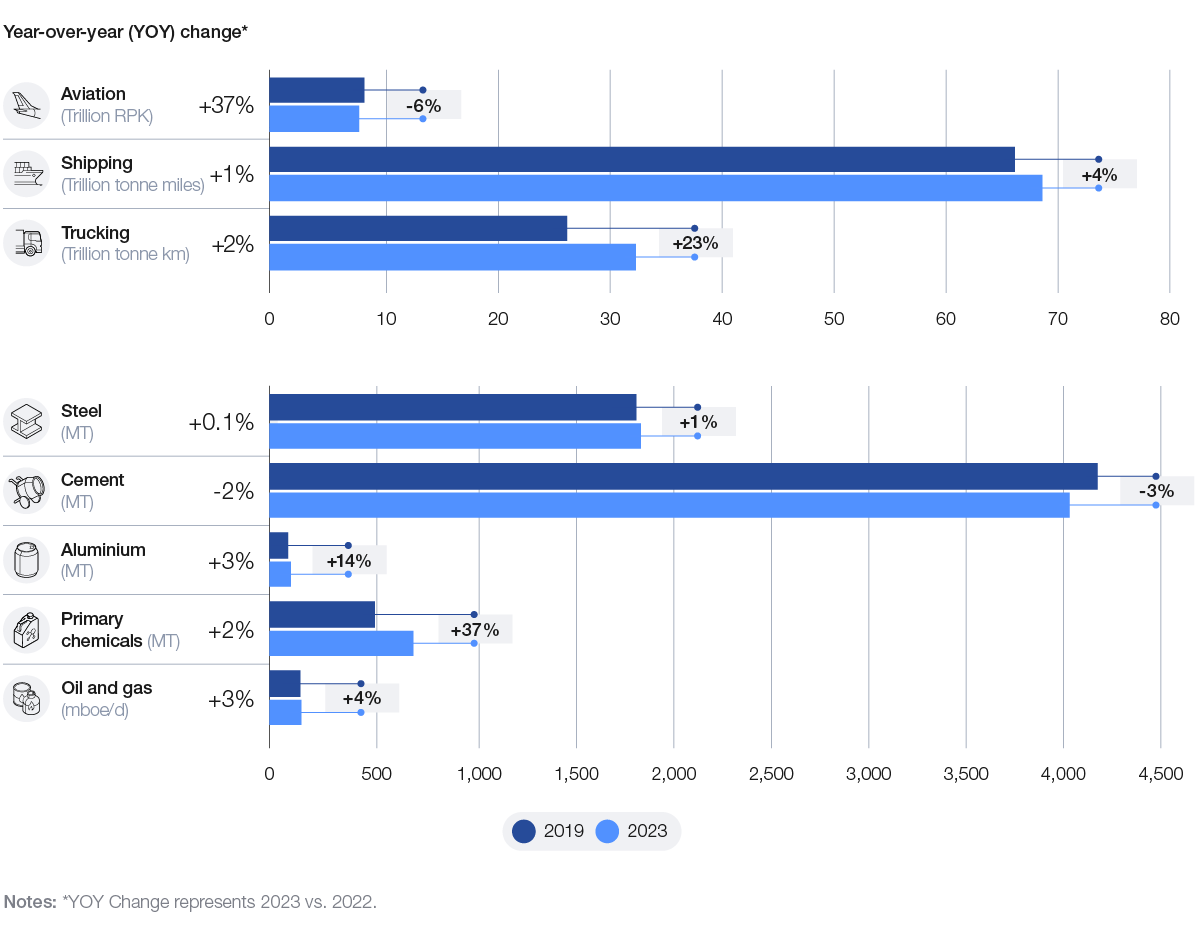
The overall demand across the eight sectors in scope saw an average 9.2% increase in the 2019-2023 period. The rise in demand has been driven by the heavy industry sectors, which saw an average 10.6% increase, where all sectors except cement saw an increase. Primary chemicals and aluminium saw the highest growth across the heavy industry sectors. Cement saw a decline, mainly due to decreased production in China, which accounts for around half of global production, due to its real-estate crisis and COVID-19 pandemic-related policies. The heavy transport sectors saw an average 6.9% increase, mainly driven by the sharp rise in trucking demand, followed by shipping, while aviation demand saw a decline.
More recently, from 2022 to 2023, the sectors in scope saw an average 5.8% increase. All sectors except cement saw an increase during this period. The rise in demand was mainly due to aviation, which saw a 36.9%26 increase recovering from the exceptional COVID-19 pandemic period drop, followed by oil and gas with a 2.9% increase.27
Figure 7: 2019 vs. 2023 demand by sector
Operational process and energy intensity
Production processes in heavy industry and operations in heavy transport sectors consume large amounts of energy, which contributes to a significant share of their GHG emissions. Efforts are being made across sectors to reduce the energy intensity and bring down energy-related emissions.
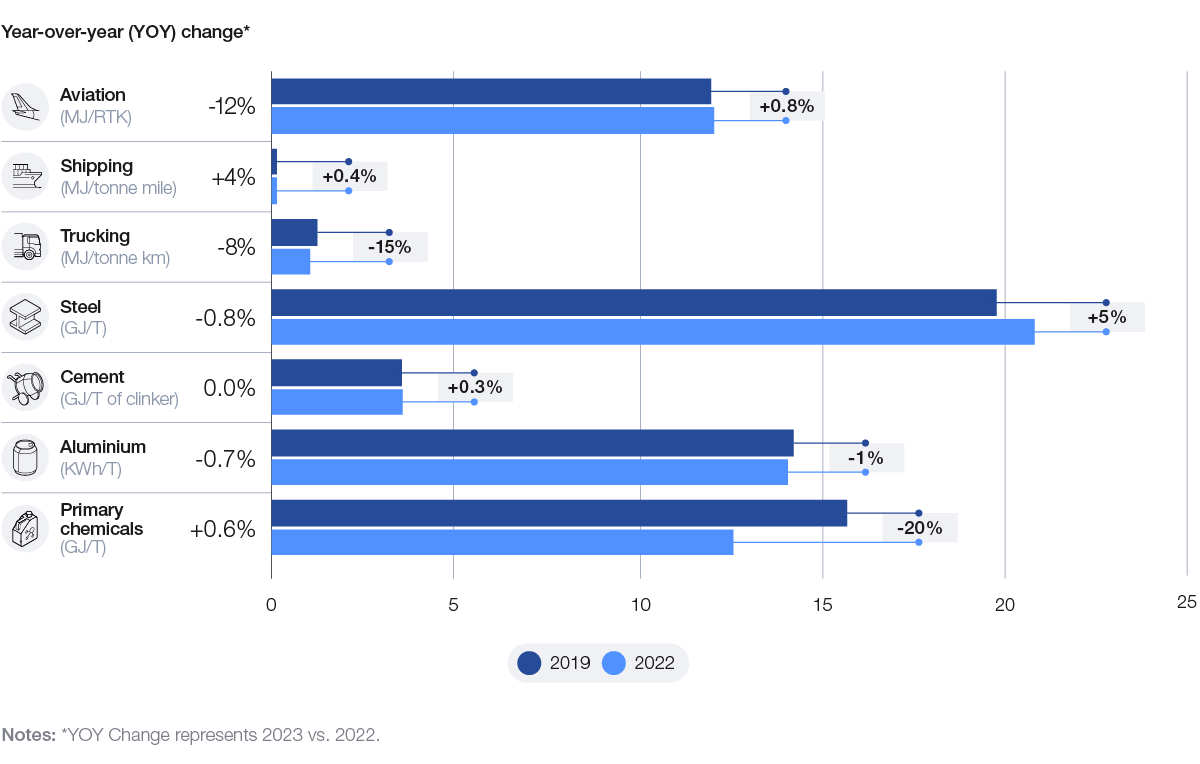
From 2019 to 2022, the sectors in scope saw a 3.9% decline in energy intensity on average. This decline was mainly driven by primary chemicals, trucking and aluminium, and was partially offset by an increase in energy intensity in steel. For primary chemicals, energy intensity has reduced due to a shift towards more efficient production processes. For trucking, increasing electrification and fuel efficiency improvements have contributed to this decline. Recycling and reuse of materials have played a major role in reducing energy intensity for aluminium. For steel, the increase in energy intensity is mainly due to increase in production in China, which predominantly uses primary processes, which are more energy intensive than secondary production processes.
More recently, from 2021 to 2022, the sectors in scope saw a 3.2% decline in energy intensity on average. This decline was mainly driven by aviation and trucking and was partially offset by an increase in energy intensity in shipping. By comparison, the global energy intensity – global energy consumed per unit of gross domestic product (GDP) – improved by 2% in the same period,28 which shows that the sectors in scope are moving faster than the global economy in terms of improving their energy efficiency.
Figure 8: 2019 vs. 2022 energy intensity by sector
Energy mix
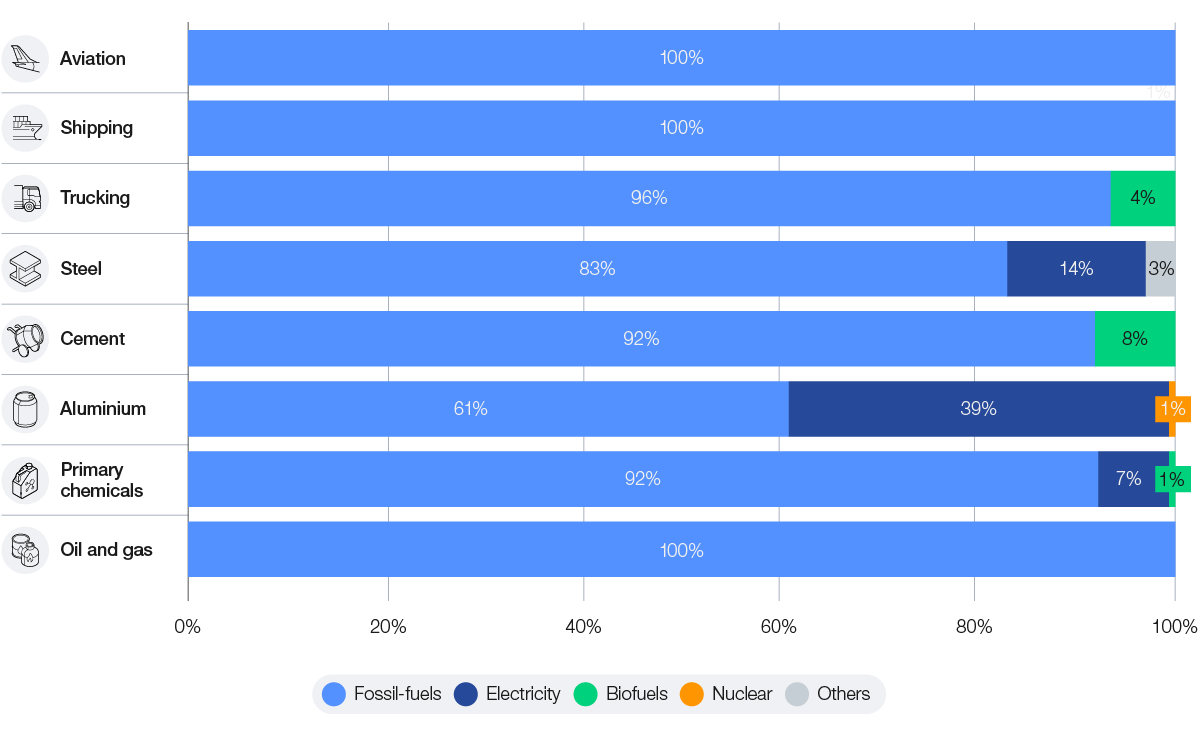
Progress in evolving the energy mix has been relatively slow, as fossil fuels continue to be the primary source of energy, forming a 90% share of the energy mix on average across the sectors in scope. In comparison, fossil fuels form 81% of the total global energy supply,29 which shows that the sectors in scope are lagging behind in their energy transition journey. Heavy industry sectors like aluminium, steel and primary chemicals have increased the use of electricity in place of coal for generating heat for their production processes. Additionally, the aluminium sector is using nuclear energy for its production. Heavy transport sectors are yet to significantly replace fuel oil with alternative fuels, though slight progress has been made in the trucking sector, where the use of biofuels has increased.
Figure 9: 2022 energy mix by sector (fossil fuels include coal, oil and gas)
Value chain emissions and offsets
Value chain emissions (or Scope 3 emissions) remain high in the heavy industry sectors, largely because their upstream supply chains (e.g. raw materials) are highly carbon intensive or the products they produce rely on petrochemical feedstocks (such as plastics). Carbon offsets that result in additionality continue to be a valuable short-term solution towards emissions reduction, until the technologies and alternative fuels required for industry deep-emission reduction are commercially available. Heavy transport sectors like aviation and shipping have seen growth in the use of offsets, supported by industry-wide carbon offset policies such as voluntary carbon offsetting in aviation, and book and claim in shipping. The oil and gas sector is also one of the largest users of offsets to compensate for emissions that cannot be easily reduced through operational changes.
3.2 Readiness
Readiness assesses the impact of energy transition strategies within the industrial and transport sectors and discusses key cross-sector themes across the five readiness dimensions: technology, infrastructure, demand, capital and policy.
– According to several scenarios cited in this report, the eight sectors are projected to reduce emission intensity by 93% by 2050. Key pathways for industrial sectors are process shifts, electrification and CCUS, while transport sectors focus on energy efficiency, hydrogen-based fuels and biofuels.
– Notable progress has been made in technologies, including battery electric planes, hydrogen and hybrid electric planes, hydrogen bunkering, ammonia-powered engines in shipping, combining blast furnace-basic oxygen furnaces (BF-BOF) with bioenergy with carbon capture and storage (BECCS) in steel, hydrogen and CCUS in cement, and downstream electrification in oil and gas.
– Infrastructure for clean power, clean fuels and CCUS requires significant expansion to meet the 2050 net-zero goal. Fossil fuels still account for about 90% of the energy used across these sectors, and less than 1% of the necessary infrastructure for the target energy mix has been established.
– Demand for low-carbon products is increasing, but the gap between demand commitments and willingness to pay green premiums limits scaling.
– To reach net zero by 2050, $30 trillion in investment is needed, with most sectors operating on limited margins, making it challenging for companies to absorb the additional costs needed to develop clean technologies while maintaining sufficient profits.
– Policies can create an enabling environment for decarbonization and adoption of clean energy across industries to support the global 2050 net zero target.
Target emissions
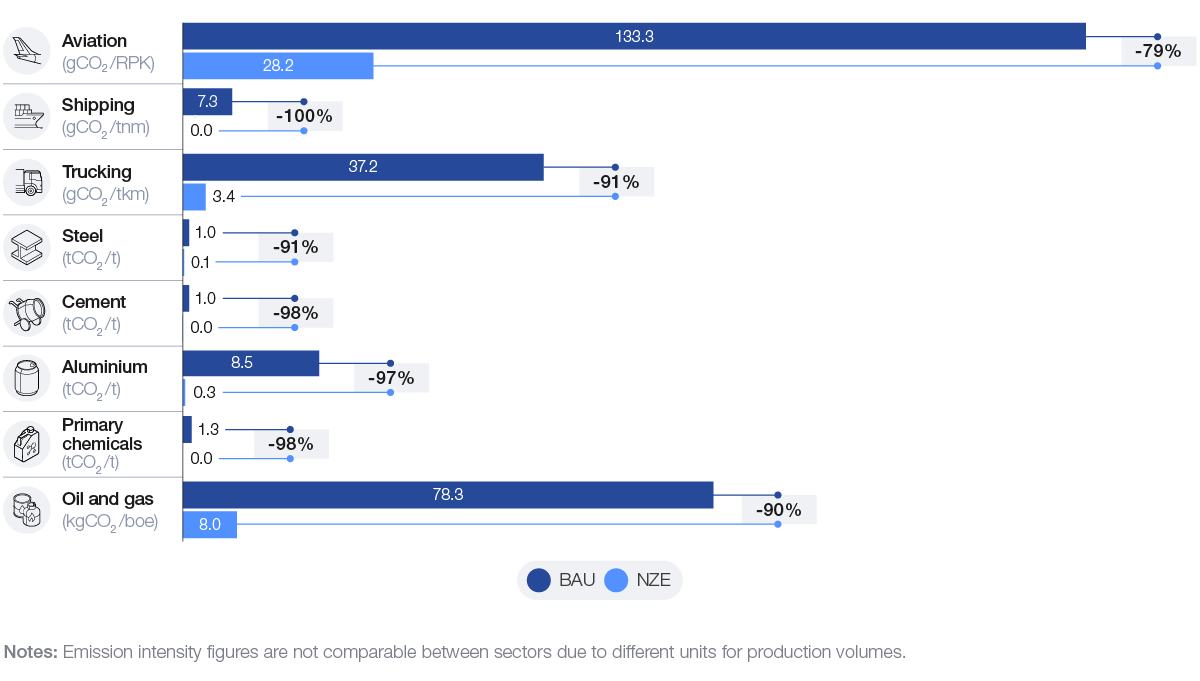
To achieve net-zero emissions by 2050 and evaluate progress across the eight sectors, this section analyses target emissions for both BAU and net-zero emissions (NZE) scenarios.
By 2050, according to several scenarios cited in this report, industries like shipping, cement and chemicals will need to nearly eliminate their direct emissions, while sectors such as aviation, trucking, and oil and gas will need to reduce direct emissions by 79%, 91% and 91%, respectively. These reductions highlight the significant efforts required across all sectors to achieve net zero, especially in those that face more challenges in reducing emissions.
Figure 10: BAU 2050 and NZE 2050 emission intensity by sector
Decarbonization levers
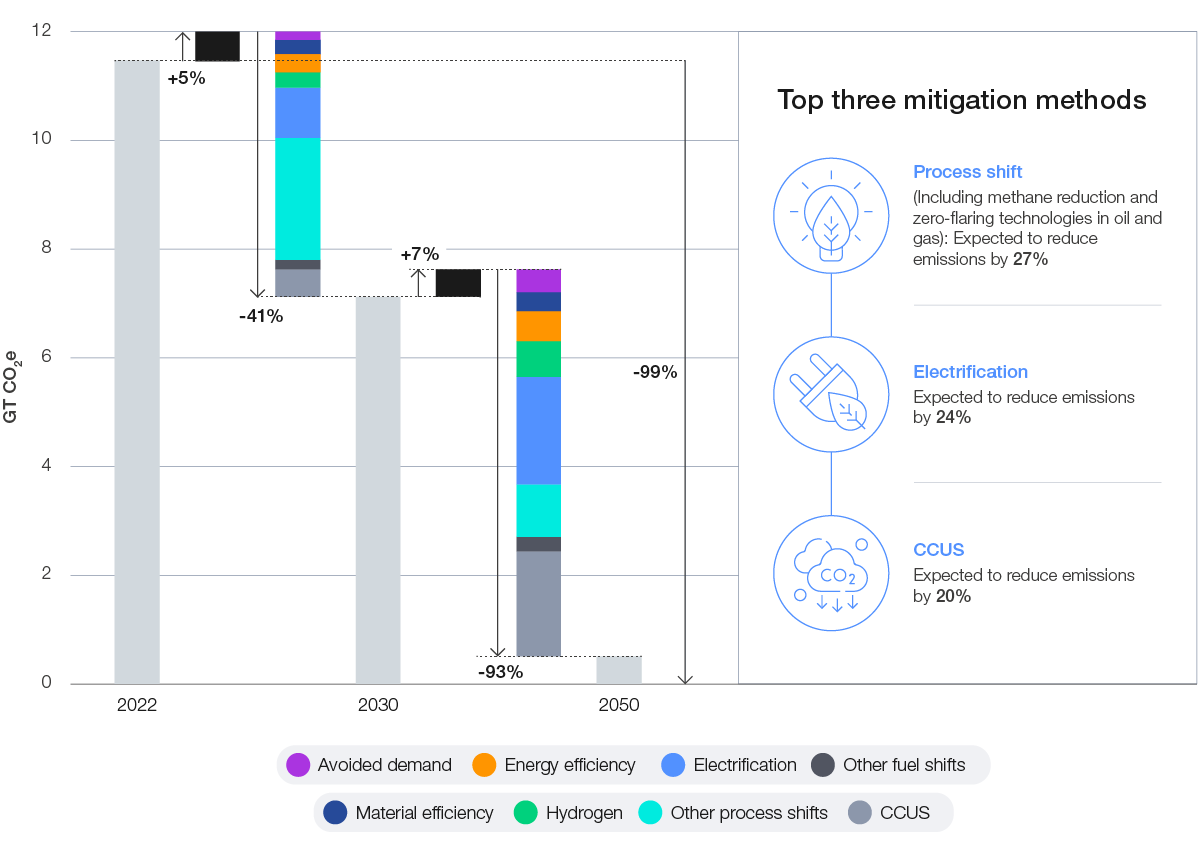
Absolute direct emissions from industrial sectors (steel, cement, aluminium, primary chemicals, and oil and gas) are projected to decrease by 41% by 2030 and 93% by 2050, largely due to the adoption of various technologies.
Figure 11: Contribution to emission reduction by decarbonization lever for industrial sectors and top mitigation methods
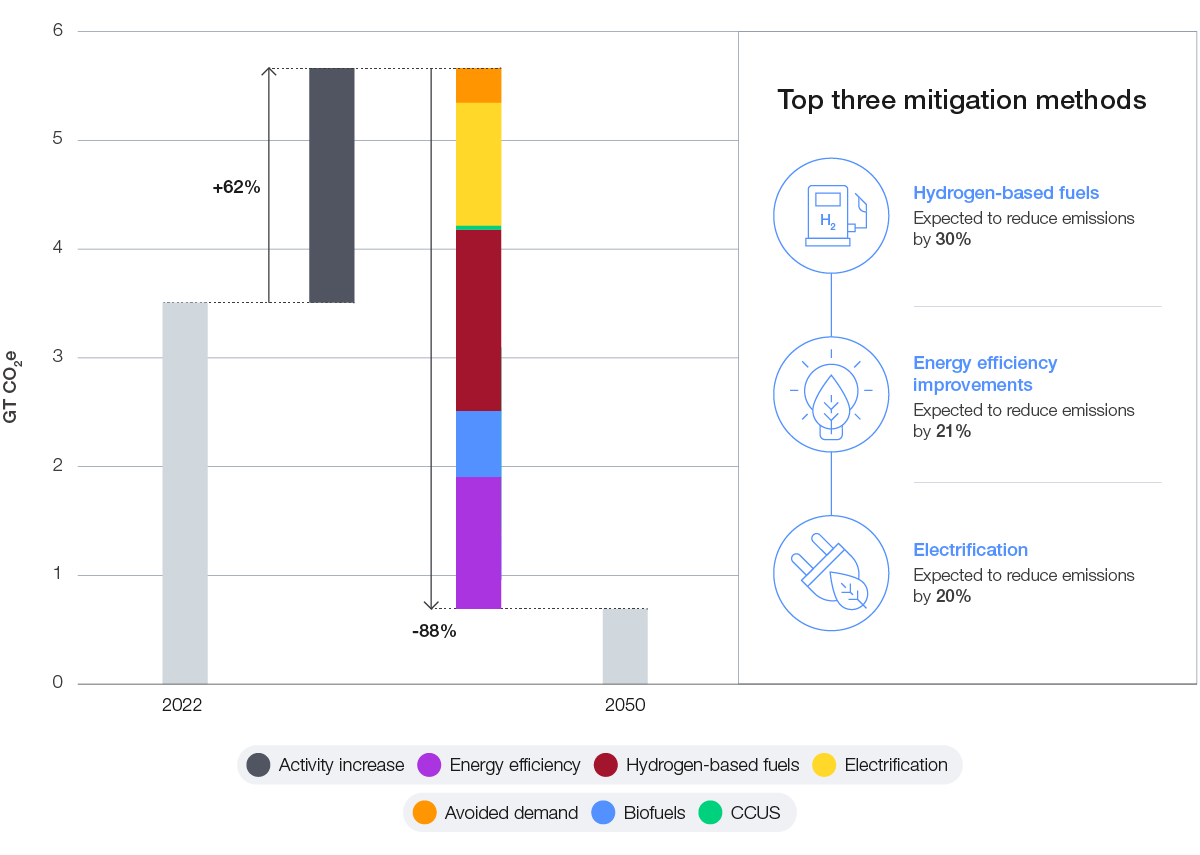
For the transport sectors (aviation and shipping), direct emissions will need to decrease by around 84% by 2050. Achieving these reductions across all sectors will require coordinated efforts and significant investment in the necessary technologies and infrastructure.
Figure 12: Contribution to emission reduction by decarbonization lever for transport sectors and top mitigation methods
Readiness scores
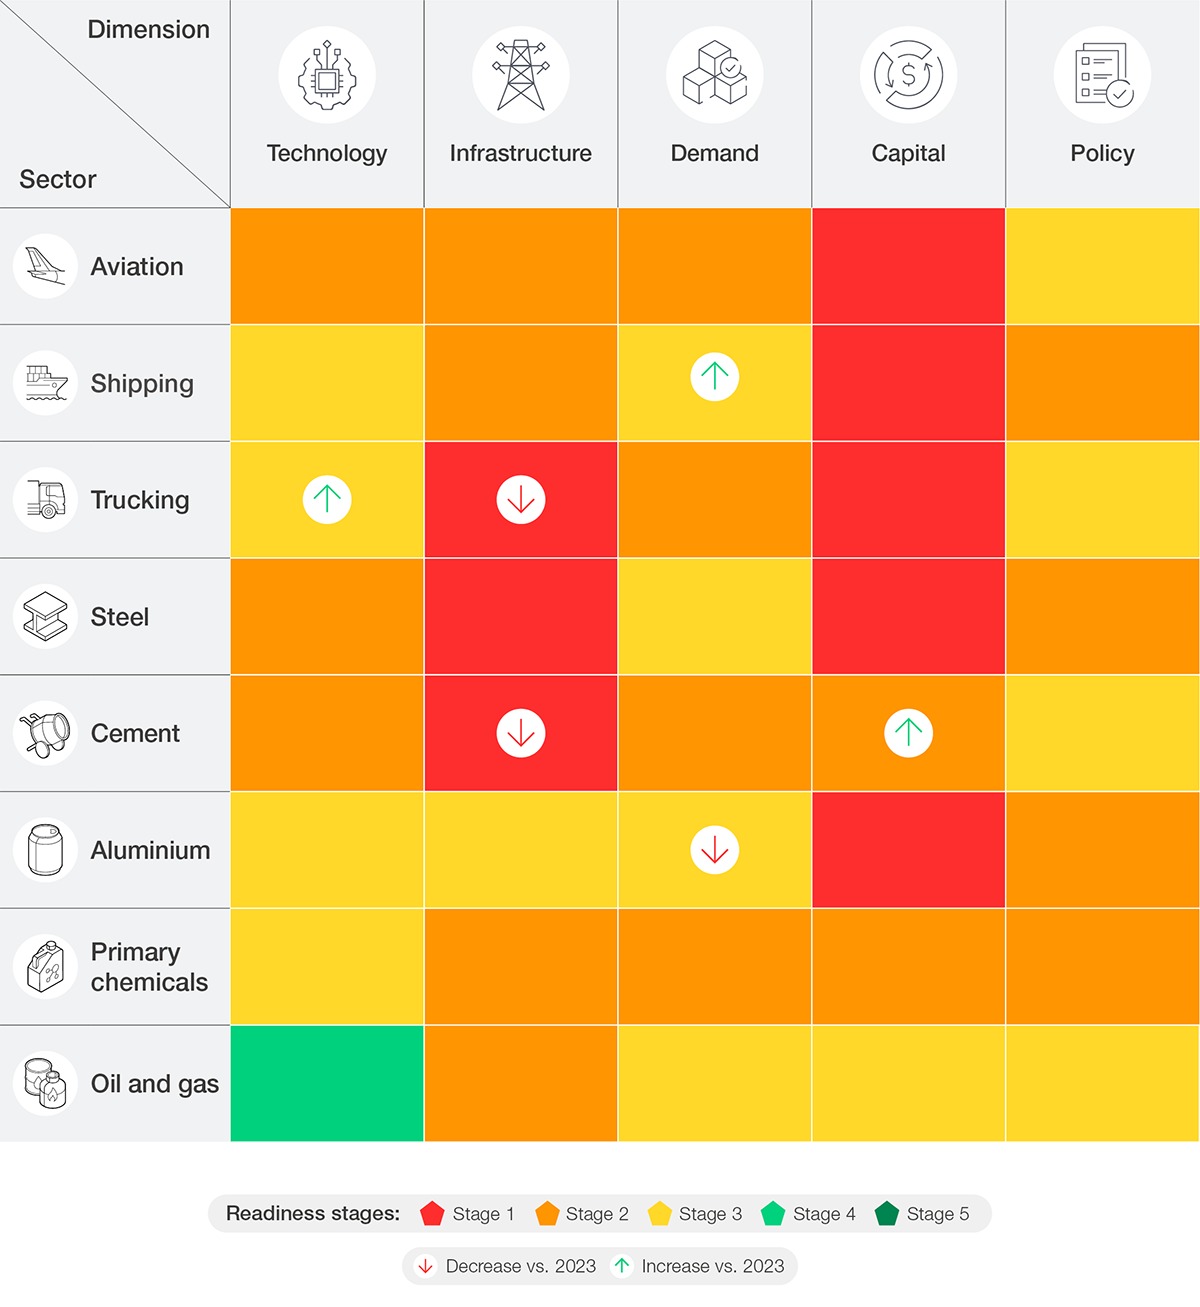
According to the readiness framework, each of the eight sectors in scope has been evaluated and assigned a score across five readiness dimensions: technology, infrastructure, demand, capital and policy. Each dimension was analysed for all sectors and scored based on the relevant sub-dimensions detailed in Section 2. The arrows indicate which dimensions and sectors have undergone changes in scores compared to 2023.
Table 1: 2024 readiness scores by sector and dimension
Technology
Key readiness question
Are the technologies needed for net-zero emissions commercially available?
Key messages
– Several technologies have seen an increase in their TRL scores compared to last year, including battery electric planes, hydrogen and hybrid electric planes, hydrogen bunkering and ammonia-powered engines in shipping, BF-BOF with BECCS in steel, hydrogen and CCUS in cement, and downstream electrification in oil and gas.
– Generative AI significantly enhances decarbonization efforts by improving asset management and operational processes, optimizing capital allocation, and automating carbon management, thereby helping companies reduce emissions and costs.
– Despite its advantages, the growing energy demands of AI systems may contribute to increased electricity consumption and modest inflation, as investments in AI could outweigh efficiency gains.
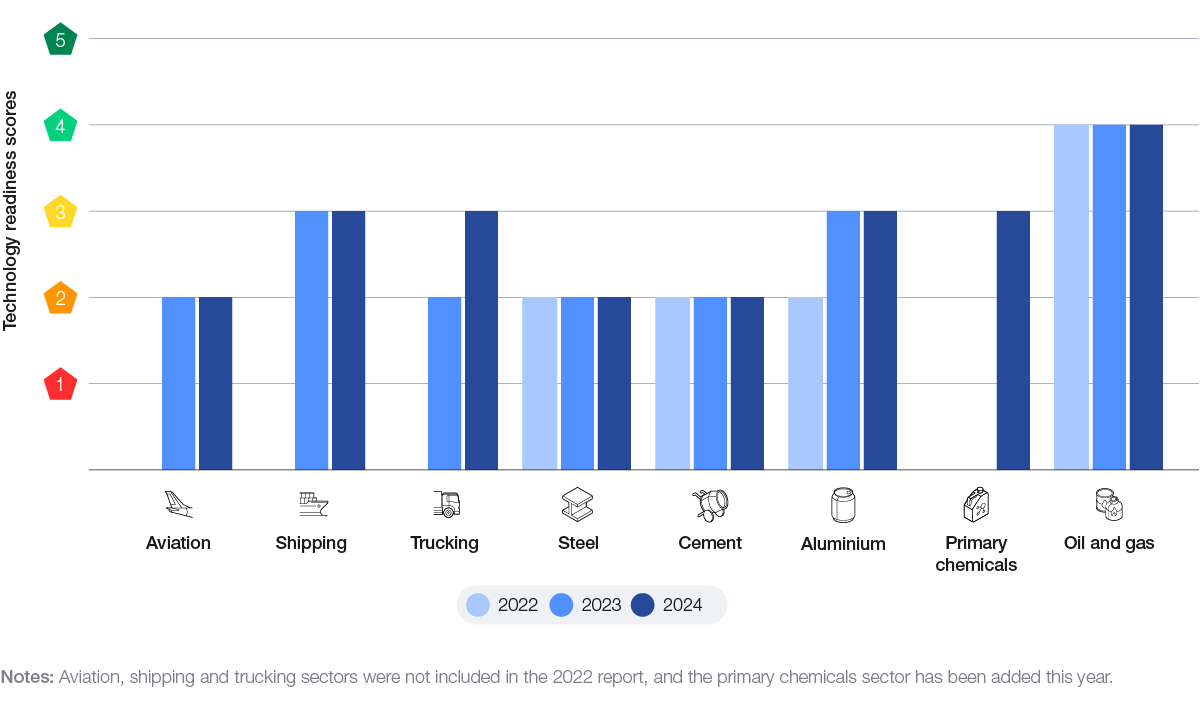
Figure 13: Scores for net-zero emissions technologies across sectors (2022-2024)
Readiness score movements in the past year:
– Trucking: The score increased from 2 to 3 during the past year, mainly driven by the advancement in hydrogen-electric trucks to early adoption phase.
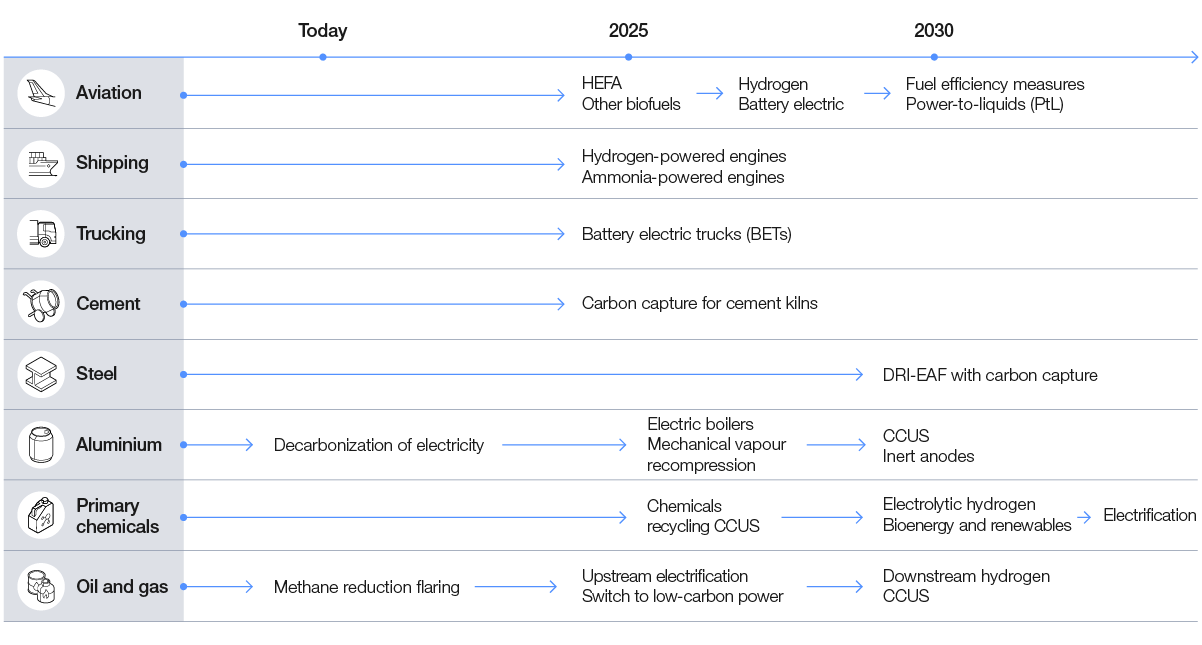
Decarbonizing hard-to-abate sectors requires the development of innovative technologies, many of which are expected to become available between 2025 and 2030. However, several technologies, such as methane and flaring reduction in the oil and gas sector, as well as the decarbonization of electricity for secondary aluminium smelting, are already mature technologies, having a TRL of 10. Meanwhile, methanol-powered engines and ammonia bunkering are nearing widespread implementation with a TRL of 9.
Challenges:
– The development and deployment of new decarbonization technologies often face prolonged timelines
– Many industrial sectors in scope require temperatures exceeding 500°C, making electrification challenging. For instance, the steel industry relies on high-temperature heat for 83% of its operations, while cement production requires it for 45%.36
– Many companies in these sectors operate with limited research and development (R&D) budgets due to relatively low profitability, limiting their ability to invest in innovative technologies for decarbonization.
– The increasing doubts about the feasibility of green hydrogen and CCUS are causing targets and projects to be cancelled.
Way forward:
Several sectors are expected to rely heavily on technologies that are not currently commercially available, such as CCUS and clean hydrogen. For example, it is estimated that CCUS could reduce emissions in the cement sector by 60% by 2050.37 As a result, it is essential to focus on reducing energy consumption by improving the energy efficiency of processes, adopting clean fuels across sectors, switching to low-carbon power sources and scaling CCUS technologies.
– Improving energy efficiency of processes: Enhancing energy efficiency is a cost-effective strategy to lower energy demand and CO2e emissions from fossil fuels. IRENA’s 1.5°C scenario suggests that improving efficiency could provide about 20% of the necessary CO2e reductions in shipping by 2050. Measures like high-efficiency propellers and waste heat recovery can significantly cut fuel consumption and emissions.38
– Adopting clean fuels across sectors: Transitioning to clean fuels, such as hydrogen and biofuels, is crucial for decarbonizing industries and transport. Clean hydrogen supply is expected to increase thirtyfold to 16.4 million tonnes (MT) by 2030 due to supportive policies. Regions with abundant renewable resources can produce green hydrogen for €3 to €5 per kilogram (kg).39 In the IEA’s 2°C Scenario, biofuels are projected to rise tenfold in the transport sector by 2060, reaching 30% of transport energy.40
– Switching to low-carbon power sources: Renewable energy sources will provide 85% of global electricity production in 2050, led by solar photovoltaic (PV) and onshore wind.41 Various sectors will need to electrify operations, although applications like electric arc furnaces (EAFs) in steelmaking may face challenges.42 In 2023, battery storage emerged as the fastest-growing energy technology, increasing over twofold year-on-year to add 42 gigawatts (GW) globally. Lithium-ion batteries experienced a remarkable price drop of 14% from 2022 to 2023,43 driven by advancements in manufacturing and economies of scale.
– Scaling of CCUS technology: According to the IEA, CCUS could contribute over 25% of emissions reductions in iron and steel by 2050. CCUS is also emerging as a key solution for chemicals manufacturing.44
Figure 14: Expected commercialization date of major technologies by sector
Digital technologies offer significant advantages to help companies in their decarbonization efforts, specifically in operational efficiency, capital and carbon management. Three major value levers have emerged for data and AI applications.
Operational efficiency: Generative AI enhances asset management and operational processes. By using predictive asset management, companies can:
– Optimize production systems: AI helps streamline the entire production process, balancing output, margins and emissions. This boosts efficiency while minimizing energy use and emissions, directly supporting decarbonization.
– Improve asset energy efficiency: AI enables better equipment monitoring, ensuring that assets run at peak energy efficiency, reducing both emissions and energy costs.
Capital projects: Generative AI optimizes capital allocation and project management by:
– Modelling energy transition scenarios: AI helps companies simulate various energy transition scenarios, enabling informed decisions on capital allocation for low-carbon and carbon-neutral projects.
– Enhancing project design: AI can generate and refine capital project designs, reducing time-to-market and minimizing capital expenditure (CapEx) overruns.
– Improving CCS: AI has the potential to lower CCS costs by up to 30%, according to the IEA.45 It enhances site selection for carbon storage through geological data analysis and optimizes CCS efficiency by monitoring the capture process.
Carbon management: Generative AI supports carbon management and sustainability initiatives by:
– Automating emissions management: AI tracks real-time energy consumption and optimizes energy efficiency at the equipment and process levels, reducing GHG emissions and lowering carbon footprints.
– Managing carbon credits: AI automates the purchase and use of carbon credits, ensuring compliance with emissions regulations while maximizing green premium opportunities.
– Decarbonizing the supply chain: AI continuously assesses suppliers’ carbon performance, helping companies choose low-carbon suppliers and reduce Scope 2 and 3 emissions across the supply chain.
– Forecasting energy and emissions: AI predicts energy demand and deviations, allowing companies to take preventive measures to avoid higher emissions and align operations with sustainability goals.
Despite its advantages, generative AI presents several challenges. The continuous operation of AI systems results in a constant peak demand for electricity from data centres, with projections indicating that their energy consumption could surpass 9% of total US electricity usage by 2030.46
Infrastructure
Key readiness question
Is the infrastructure to enable the use of low-emission technologies available?
Key messages
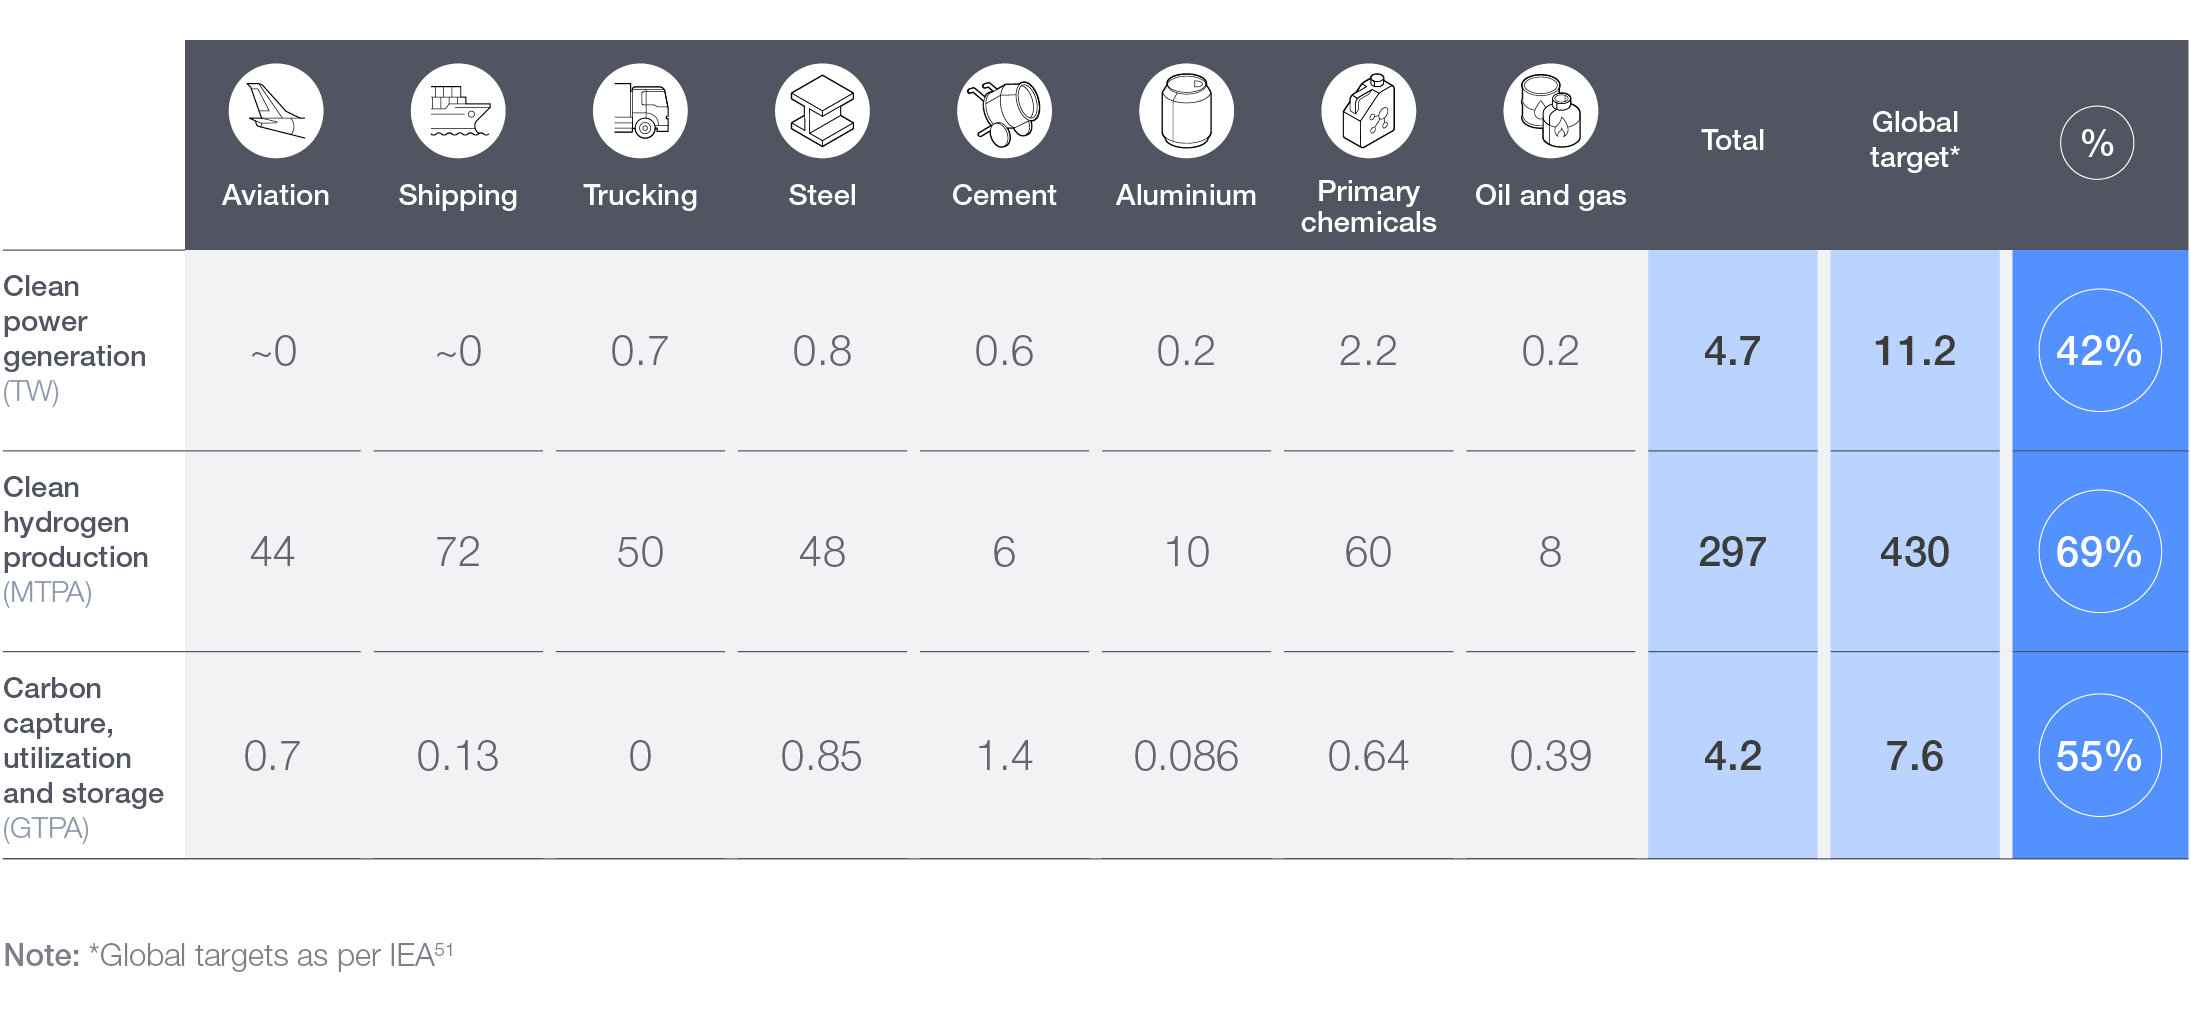
– The cumulative infrastructure capacity required by 2050 across the sectors in scope in their net-zero scenario is 4.8 terawatts (TW) of clean power, 297 million tonnes per annum (MTPA) of clean hydrogen and 4.2 gigatonnes per annum (GTPA) of CCUS.47
– Compared to IEA estimates for the global target capacity in 2050 in their Net Zero Emissions by 2050 Scenario, the requirement from these sectors contributes to 42% of the global target for clean power, 69% for clean hydrogen and 55% for CCUS.48
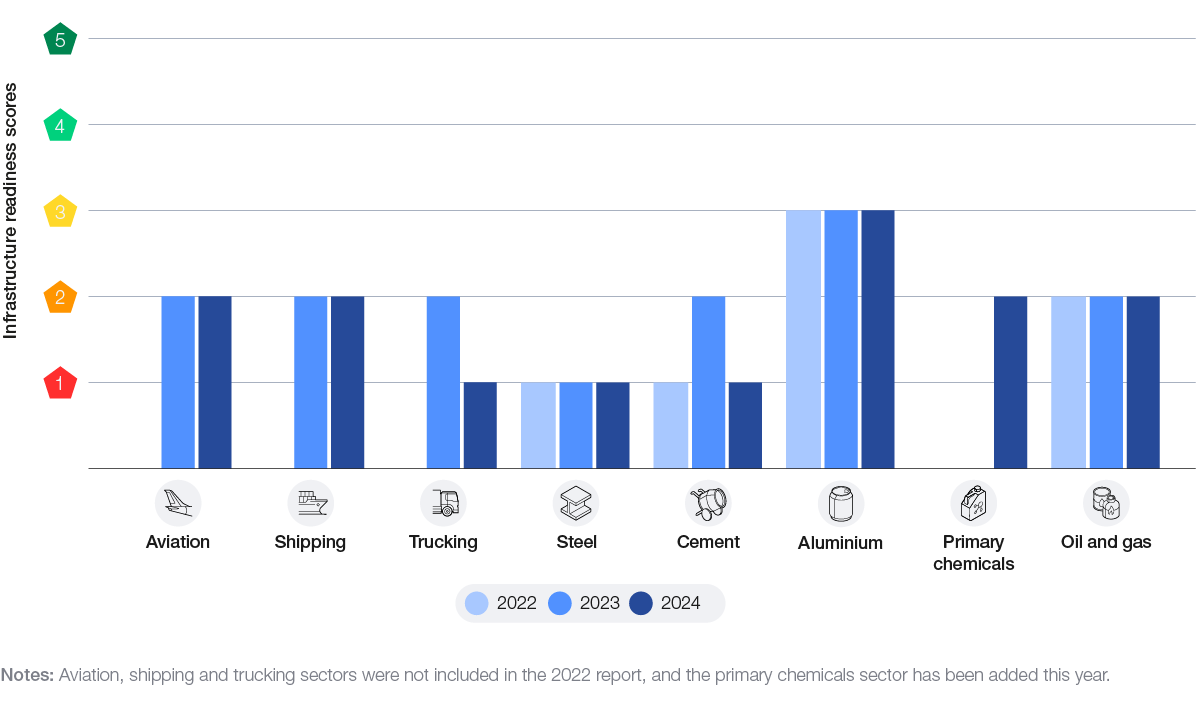
Figure 15: Scores for low-emission technology infrastructure across sectors (2022-2024)
Readiness score movements in the past year:
– Cement: The score decreased from 2 to 1 during the past year, mainly due to limited advancements in expanding clean power and CCUS capacity, and the significant capacity increase required to meet the 2050 infrastructure requirements as compared to the other sectors in scope.
– Trucking: The score decreased from 2 to 1 during the past year, mainly due to lack of substantial increase in the use of clean hydrogen and clean power to meet energy requirements, and the significant capacity increase required to meet the 2050 infrastructure requirements as compared to the other sectors in scope.
To achieve the 2050 net-zero target for the hard-to-abate sectors in scope, clean power, clean hydrogen and fossil fuels abated by CCUS will need to form over 90% of the final energy mix. Thus, it is important to look at the availability of infrastructure to support this energy requirement across each of the sectors in scope.
Currently, fossil fuels contribute to approximately 90% of the energy used across these sectors, and less than 1% of the required infrastructure to meet the final energy mix targets is in place. In comparison, fossil fuels form 81% of the total global energy supply,49 which shows that the sectors in scope are lagging behind in their energy transition journey.
The cumulative infrastructure capacity required across the sectors in scope is 4.7 TW clean power, 297 MTPA clean hydrogen and 4.2 GTPA CO2 utilization. Compared to IEA estimates for the global target capacity in 2050, the requirement from these sectors contributes to 42% of the global target for clean power, 69% for clean hydrogen and 55% for CCUS.50
Key transition infrastructure levers
Figure 16: 2050 NZE infrastructure capacity required by sector
Clean power:
Clean power derived from sources like solar, wind, hydropower and nuclear is expected to be the primary means for reaching global net-zero ambitions. Regarding decarbonizing hard-to-abate heavy industries and transport, clean power has direct and indirect applications, including the electrification of industrial processes and the production of clean fuels like green hydrogen. In aggregate, by 2050, clean power is expected to be an average 22% of the final energy mix across the sectors in scope. However, the application and impact of clean power on these sectors vary.
Clean power’s direct application in decarbonizing is especially critical for sectors like steel, aluminium and trucking, where clean electricity is better positioned to replace fossil fuels in specific processes. For instance, aluminium production has already made strides by using renewable electricity, which currently accounts for 39%52 of its smelting energy mix for primary aluminium. Steel production can benefit from electrifying operations like steel rolling, and the trucking industry can adopt battery-electric trucks (BETs), which run directly on clean electricity, reducing emissions in short- and medium-haul transport.
Indirectly, clean power is necessary for the production of green hydrogen and other clean fuels, which are expected to account for 40% of emissions reduction in heavy transport sectors, and 12% in heavy industry sectors (including oil and gas) by 2050. For industries like steel and chemicals, which require high temperatures and use fossil fuels as feedstock, green hydrogen offers a solution. Green hydrogen, produced via electrolysis powered by renewable energy, can help replace coal in steelmaking or serve as a clean feedstock in chemical production, such as for ammonia and methanol. In transport, green hydrogen and synthetic fuels produced from renewable electricity will be vital in decarbonizing long-haul trucking, aviation and shipping, where direct electrification is challenging due to limited availability of electrification technologies and nature of their energy needs.
Clean fuels:
The transition to clean fuels and feedstocks is essential for achieving emissions reductions in heavy industrial and transport sectors by 2050. The key types of clean fuels used in these sectors include:
– Clean hydrogen: Hydrogen (particularly green hydrogen) produced using renewable energy sources is essential for various industrial applications. Blue hydrogen is also expected to play a role.
– Advanced biofuels: Derived from feedstocks like agricultural residues and waste oils, and sustainable energy crops that do not compete with food need. Sustainable aviation fuel (SAF), in particular, is crucial for reducing aviation emissions.
– Ammonia: Used as a zero-emission fuel (ZEF) in the shipping industry, ammonia can be produced from green hydrogen or from natural gas coupled with CCS.
– Methanol: Another clean fuel for shipping, methanol can be produced from renewable sources and offers a lower carbon footprint.
– Waste: Renewable municipal waste, sewage and landfill gas, and residue waste are important in some applications such as in kilns in the cement industry.
The analysis shows that an average 61% of energy needed in 2050 climate scenarios for heavy transport sectors, and 21% for heavy industry sectors will be sourced from clean fuels.
The sectors in scope often require high energy density fuels (such as in shipping and aviation), high temperature process heat (steel, cement) or feedstock to produce secondary products (chemicals). While some of these processes and fuels can be replaced by other energy carriers (such as electricity), many cannot, and there will be strong competition for those clean electrons for uses in other sectors. Thus, it is imperative that clean fuels develop alongside electrification.
In the shipping industry, clean fuels such as ammonia and methanol are essential to meet the International Maritime Organization’s (IMO) targets for achieving net-zero emissions by or around 2050. Ammonia and methanol offer an alternative to traditional marine fuels, significantly lowering the carbon footprint of maritime transport when they are produced from low- to zero-carbon energy sources (such as biomass or clean electricity). In the aviation sector, SAF is expected to play a crucial role. SAF, derived from renewable feedstocks like agricultural residues and waste oils, can reduce lifecycle emissions by up to 80% compared to conventional jet fuel. The analysis shows that 400 MTPA of SAF alone is needed in the sector by 2050. Meanwhile, the trucking industry is exploring the use of hydrogen and biofuels to replace diesel, thereby reducing emissions and improving air quality; however, the sector can be more easily electrified for certain transport cases.
In the heavy industrial sectors such as steel, chemicals and cement, clean fuels are equally critical. The steel industry is transitioning to green hydrogen to replace coal in the production process, and green hydrogen is expected to contribute to 21% of steel emissions reduction by 2050.53 The chemicals industry receives 93% of its energy from fuels but will also need to shift towards green hydrogen, ammonia and methanol to reduce emissions. In the cement industry, the use of alternative fuels like biomass and waste-derived fuels is being explored to lower the carbon footprint. These transitions are not only essential for meeting environmental targets but also for ensuring the long-term viability and competitiveness of these industries in a low-carbon economy.
Carbon capture, utilization and storage (CCUS)
Hard-to-abate sectors such as cement, steel, chemicals and aluminium are characterized by emission-intensive processes that are challenging to decarbonize using methods such as clean power and process changes. To address this, a multi-faceted approach involving CCUS and carbon offsets is essential. CCUS, in particular, is expected to account for 18% of global emissions reduction in the heavy industry sectors, and 1% in the heavy transport sectors in scope by 2050. Moreover, CCUS facilitates the production of blue hydrogen, which can significantly reduce emissions by providing a low-carbon fuel alternative for heavy industry and transport.
In 2024, global operational CCUS capacity reached over 50 MT of CO2 per year, with over 110 commercial-scale projects potentially reaching final investment decision (FID).54 If these projects proceed as planned, CCUS investment could rise almost tenfold to $26 billion by 2025, boosting global CO2 capture capacity to 430 MT per year and storage to 620 MT per year by 2030.55 However, despite progress, current CCUS deployment lags behind net-zero needs, with only 20% of the announced capture capacity and 15% of the storage capacity for 2030 in place or reaching FID.56 Industrial sectors are even further behind, representing less than 10% of the announced global capacity, far below the 25% of CO2 they need to capture by 2030 under the IEA Net Zero Scenario.57 High costs, technological challenges, insufficient CO2 transport and storage infrastructure, and regulatory uncertainties remain major barriers to scaling CCUS in time to meet emission reduction targets.
Government investments, such as the $12 billion from the US Infrastructure Investment and Jobs Act and various European initiatives, have significantly supported the expansion of CO2 pipelines and storage infrastructure, which must be available promptly to meet growing CCUS demand. ENI has successfully secured UK government funding to support its Hynet Project on creation of a CCUS infrastructure network by 2030.58 Equinor, Shell and Total have invested in the Northern Lights project, the world’s first cross-border CO2 transport and storage facility, which is now ready for use.59
Challenges:
– Clean power: Policy uncertainties and delayed policy responses to the new macroeconomic environment, insufficient investment in grid infrastructure preventing faster expansion of renewables, cumbersome administrative barriers and permitting procedures and social acceptance issues, and insufficient financing in emerging and developing economies
– Clean fuels: Limited international collaboration in terms of supportive policies to increase production of hydrogen-based fuels and biofuels, and needed infrastructure, combined with a lack of clear demand signals in terms of demand projections across sectors and pricing that is competitive with fossil fuels. Carbon standards and accounting are also insufficient to accurately measure and assess fuel options, and enable comparability and cross-border trade.
– CCUS: High costs related to technology and infrastructure, insufficient regulatory frameworks and incentives to support large-scale adoption, and the need for enhanced public and industry trust in its effectiveness and safety
Way forward:
While clean power is increasingly available and crucial for decarbonizing hard-to-abate sectors, much greater investment is needed to achieve net-zero targets. Approximately 50% of the total investment will come from the broader ecosystem, with a notable portion allocated to energy infrastructure. By 2050, clean power is projected to account for 26%,60 100%61 and 60%62 of the steel, aluminium and trucking energy mix by 2050, respectively. On the other hand, the relative role of renewables and electrification in the cement and chemicals sectors is more limited, with clean power expected to be only 8%63 of the 2050 power mix for cement, and approximately 0% for chemicals.64
To reach net-zero targets, a wider array of solutions, including clean fuels, will be essential. The IEA and IRENA indicate that about half of final energy demand in net-zero scenarios will come from non-electron sources. These include renewable molecules such as liquid, gaseous and solid clean fuels, which are especially important for sectors with non-energy uses, such as feedstocks.
CCUS will also be a key component, with new players like gas infrastructure developers, chemical companies and capture-as-a-service providers entering the market. This increased competition helps reduce costs, particularly through the creation of CCUS hubs, where infrastructure is shared by multiple emitters. Despite the growth in CCUS, sectors like aviation will still require carbon offsets for remaining emissions, necessitating collaboration among governments, businesses and stakeholders to address challenges like verification and transparency.
Industries and co-located companies from different industries can benefit from collaborating with each other through shared infrastructure models (such as infrastructure hubs and industrial clusters) to improve access to the required clean energy, by capitalizing on economies of scale.
Demand
Key readiness question
Can the market support low-emission products given the green premiums and 2030 project progress?
Key messages
– Demand signals for low-carbon products are increasing, but the gap between demand commitments and willingness to pay green premiums puts clean technology investments at risk.
– Key barriers for scaling demand include unclear standards for carbon thresholds, uncertainty in measurements, low willingness to pay and limited previous experiences and typically unbinding offtake agreements at scale for low-carbon products.
– Collaboration between sectors and policy-makers is needed to establish clear standards, improve reliability of carbon measurements and address high costs to encourage the adoption of low-carbon products.
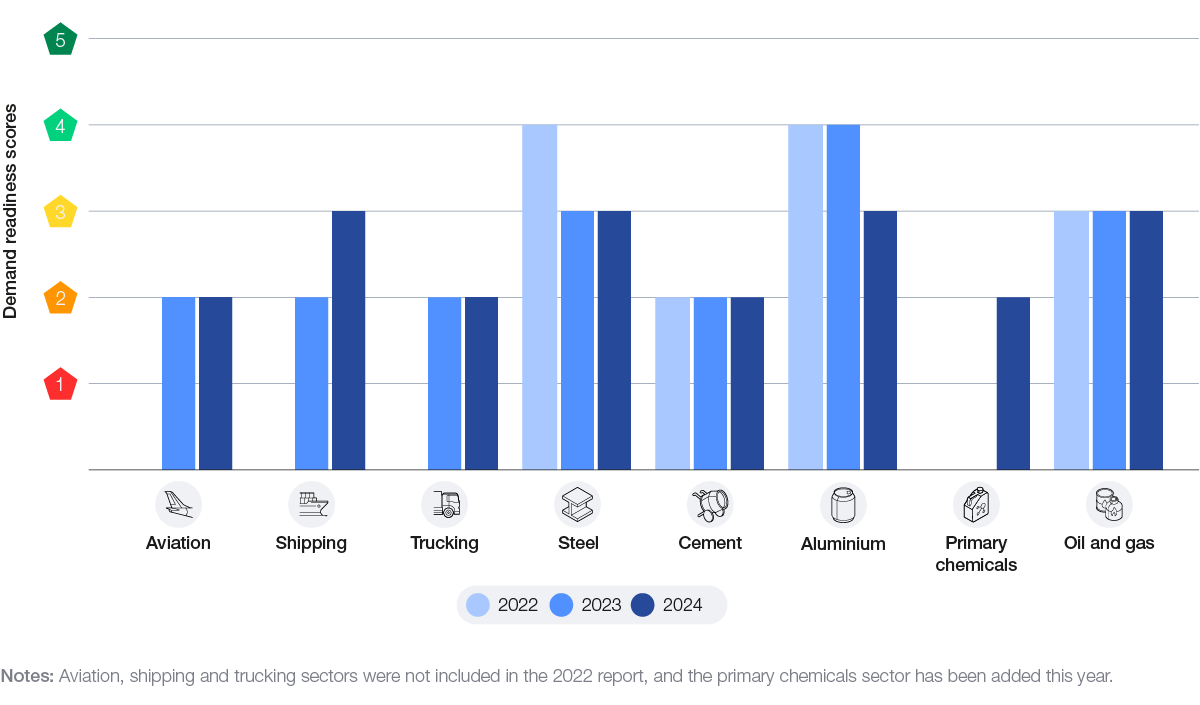
Figure 17: Demand scores for low-emission products across sectors (2022-2024)
Sectors with readiness score movements in the past year:
– Shipping: The score increased from 2 to 3 compared to last year as MPP’s announced projects exceeded the 2030 target.
– Aluminium: The score decreased from 4 to 3 compared to last year due to limited progress towards the MPP’s announced projects of 70 low-carbon refineries and smelters by 2030.
Demand signals for low-carbon products are gradually growing and are starting to be tested for scale and associated green premium potential. The apparent disconnect between demand commitments and readiness to pay a green premium is weakening the business case for low-carbon producers being willing to invest in clean technologies.
Challenges
Currently the main barriers for scaling demand include:
– Standards and definitions: Lack of clear and unified industry-wide standardized thresholds for low-carbon and near-zero emission products impedes product comparison. Carbon footprint methodologies and emissions tracking standards have been developed in most sectors but are not being implemented consistently to reach widespread adoption.
– Auditability: There is a lack of clear verification for carbon footprint calculations, which affects trust in these methods and slows down demand for low-carbon products.
– Willingness to pay premium: The layered costs of using multiple low-carbon materials in products can add up significantly, especially in business-to-business (B2B) markets, making adoption costly and limiting demand.
– Offtake agreements: The critical mass needed for offtake agreements in most sectors has not been established yet. Additionally, the non-binding nature of most offtake agreements limits pace.
Way forward:
Hard-to-abate sectors face a gridlock in decarbonization due to systemic inability to effectively distribute the costs along the value chain. Breaking through would require unparalleled collaboration and realization that the costs of decarbonization need to be shared among the industry players and society.
Sectors have started addressing barriers to standardizing carbon content measurement through various initiatives. For example, IATA’s TrackZero provides a comprehensive methodology for aviation. The Industrial Transition Accelerator (ITA) is collaborating with standard-setters to promote standards in key sectors like aviation fuel, ammonia, aluminium, cement and steel.65 Companies must enhance transparency in carbon accounting and collaborate across value chains with policy-makers and industry bodies to align sector-wide standards, methodologies and definitions, ensuring consistent implementation for decarbonization progress.
The First Movers Coalition (FMC), accounting for over 100 corporate members, has established ambitious purchasing commitments for low-carbon and near-zero industrial products across several sectors. For example, regarding steel, FMC members have set a target for at least 10% of their steel purchases to be on near-zero emissions steel by 2030. The coalition helps in resolving the “first mover disadvantage” challenge by establishing a strong demand signal to encourage suppliers and investors to break the gridlock.
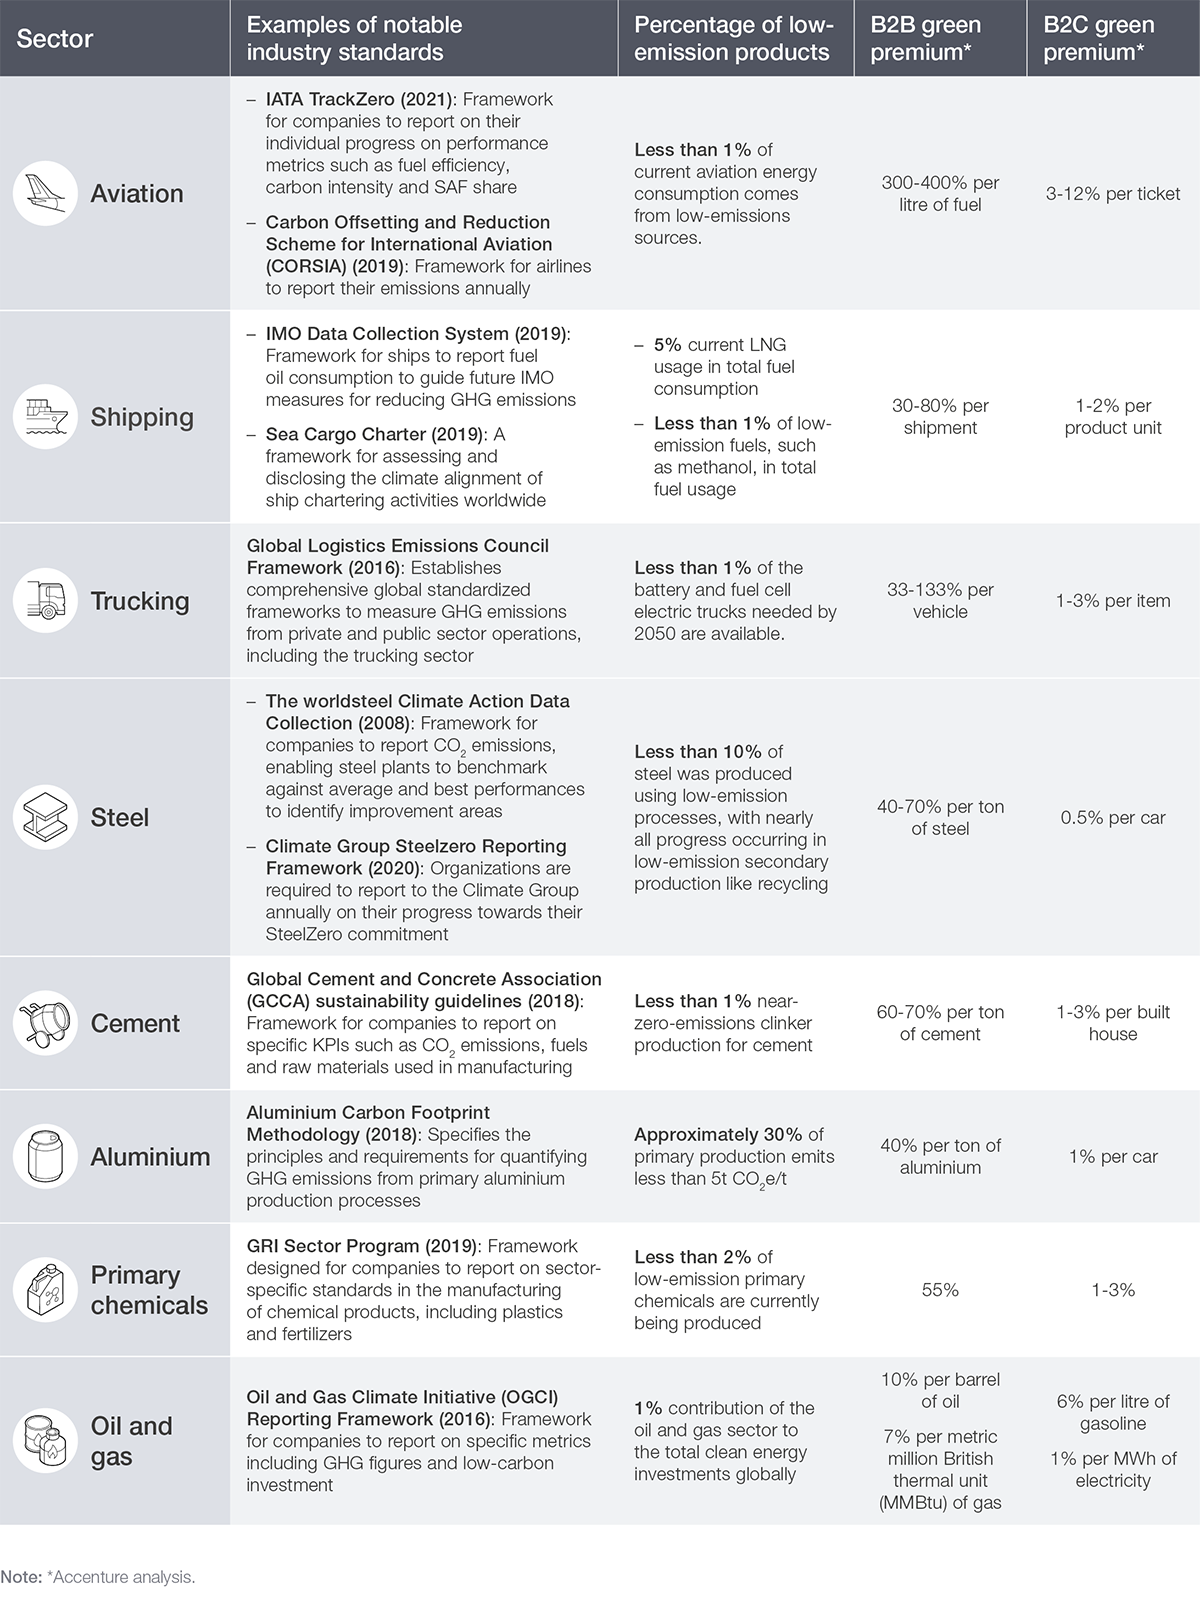
The sectors must reduce the currently high B2B green premiums to align consumer expectations with willingness to pay. For example, for the shipping sector, biofuels and hydrogen-based synthetic fuels are 1.5 to 4 times and 2 to 6 times the cost of conventional bunkering fuel, respectively. Having clear price points on consumer willingness to pay for different products would incentivize suppliers to target cost reduction innovation and build economies of scale.
Table 2: Key industry standards, green premium and the percentage of low-emission products
By promoting energy efficiency and demand-side management, we can reduce overall consumption, helping to alleviate the pressure on prices. Programmes that encourage energy-saving behaviours can help consumers save money while contributing to carbon reduction goals.
The transition to a low-carbon economy presents an opportunity to enhance daily life, encouraging beneficial behavioural changes and innovation. While some price adjustments for essential products may occur, proactive planning and supportive policies can help balance these effects, paving the way for a more sustainable and equitable future for all. The share of societal costs of industry decarbonization and broad energy transition underscores the need for equitable transitioning. Policy-makers must prioritize support for vulnerable populations most affected by price increases and potential job losses. Measures such as subsidies for low-income households, investment in public transport and incentives for energy efficiency can encourage positive behavioural changes, easing the financial burden and protecting those least able to afford the transition. For instance, the Just Transition Fund not only provides grants and technical assistance but also promotes policy development and peer learning to support communities facing job displacement, such as those impacted by the decline of coal-based industries.66
Capital
Key readiness question
Are returns sufficient to drive investments towards low-emission assets?
Key messages
– To meet net zero scenarios across the eight sectors by 2050, $30 trillion is needed as cumulative additional investment, with 57% required by the ecosystem and 43% by sectors.67
– Increased capital spending and funding strategies are essential for advancing clean technology development.
– Companies can offset decarbonization costs by tapping into new markets, setting premium prices, and lowering energy and material expenses.
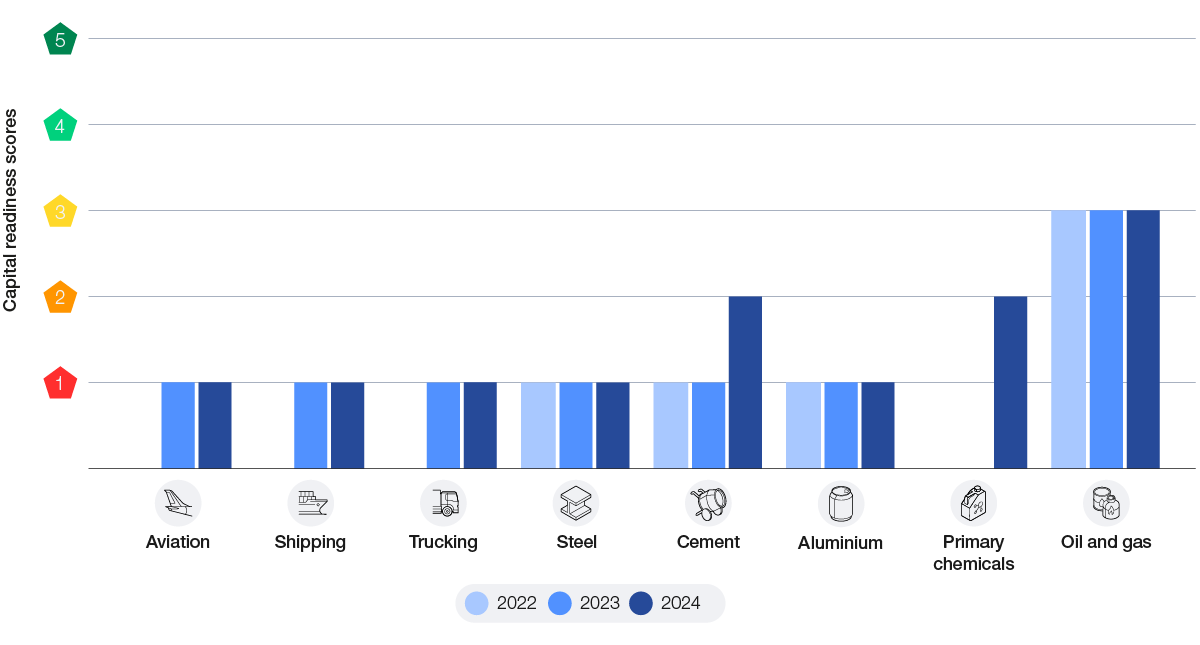
Figure 18: Capital scores for low-emission assets across sectors (2022-2024)
Sectors with readiness score movements in the past year:
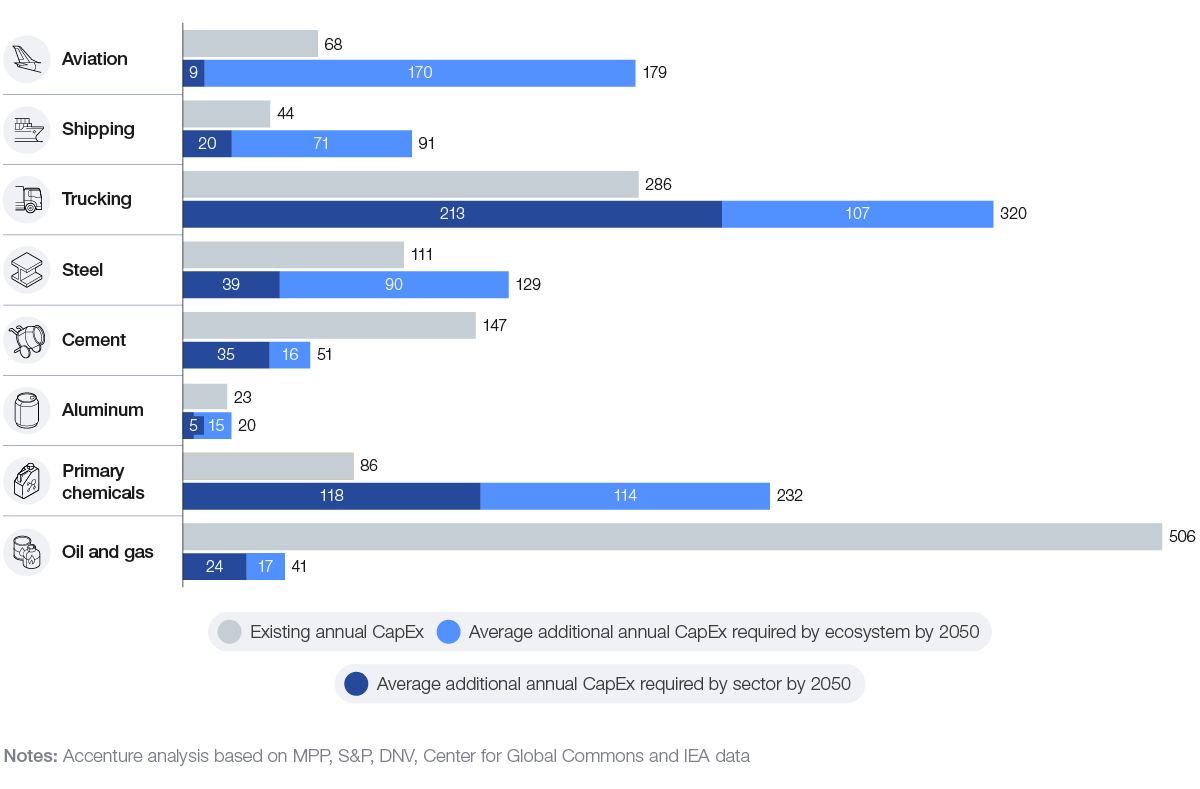
– Cement: The score increased from 1 to 2 during the last year, as current capital levels increased, leading to an additional 35% of annual CapEx needed, compared to 71% previously.
To meet net-zero scenarios, the eight sectors in scope need an estimated additional $30 trillion in investments with more than 68% of this needed for trucking, aviation and primary chemicals. Of the total investments, 57% will be required from the ecosystem for enabling infrastructure, while 43% will be needed within the sectors to retrofit existing assets and develop new technologies.68
In last year’s report, the investment was divided across infrastructure and capital sections, with $13.5 trillion for infrastructure and $11 trillion for industries to retrofit assets. This year, those figures have been combined into the capital section.
Challenges
– Investments in low-carbon technologies, such as clean hydrogen and CCUS, require significant capital that often exceeds current spending levels.
– Most sectors in scope operate with low profit margins (typically between 3% and 10%), except for the oil and gas sector, which has a higher margin of about 15%.69 This makes it hard to cover the additional costs of decarbonization while maintaining profitability.
– Increased demand for capital from multiple companies increases competition, making it harder for smaller firms to secure necessary funding.
Figure 19: Existing annual CapEx vs. additional annual required by 2050 by sector and ecosystem ($ billions)
Way forward
To decarbonize high-emission sectors, companies can use several capital-raising strategies.
Green debt issuance, such as green bonds or sustainability-linked loans (SLLs) can provide the required funding by linking loan terms (e.g. interest rate) to sustainability metrics. This incentivizes companies by linking financial impact directly with sustainability performance. For example, voestalpine, an Austria-based steelmaker, has successfully issued the first green corporate bond for around $550 million to finance sustainable projects. Among these is voestalpine’s greentec steel, which refers to the production of high-quality steel with a reduced carbon footprint.70 Green securitization can unlock financing in debt capital markets for smaller-scale, low-carbon and climate-resilient assets, improving access to capital and reducing costs.71
Moreover, special funds are helping to decarbonize high-emission sectors, such as the Climate Investment Funds (CIF), which recently announced the launch of its Industry Decarbonization Program. This programme offers up to $1 billion to support the transition of heavy-emitting sectors in developing countries. The programme will spur innovation, provide proof of concepts for new technologies and advance a just transition.72
In addition, public-private partnerships (PPPs) can help in raising capital for decarbonization efforts. For instance, the US Department of Energy has allocated $2.2 billion in funding for the Appalachian Hydrogen Hub and the Gulf Coast Hydrogen Hub.73 National and regional development banks can enhance private sector investment by mitigating risks and facilitating access to capital, while development finance institutions (DFIs) improve the bankability of green projects through de-risking instruments and technical assistance.
Private equity firms are also increasingly investing in long-term decarbonization opportunities for high-emitting sectors. For example, Ara Partners focuses on investing in technologies that replace polluting industrial processes, as well as in businesses that support decarbonization platforms through their products and services.74 Capital recycling also serves as an effective financing strategy for long-term decarbonization projects. By selling or leasing assets that have transitioned to a lower-risk phase, firms can repurpose the capital to invest in new green initiatives. This approach enhances asset efficiency while providing ongoing funding for decarbonization efforts.75
Most of the investments needed will come from the private sector. Companies will invest only if the business case is robust enough and risk-adjusted returns can be earned over time. Governments and other relevant actors can play an important role in de-risking investments through targeted policies and blended financing, especially for “first-of-its-kind” applications of key technologies in hard-to-abate sectors.
Additionally, to further help developing countries raise capital, strategies such as increasing concessional capital from institutions, expanding private investment through tools like blended finance and risk mitigation, and enhancing domestic financial markets and tax systems have emerged. Additional approaches include sovereign debt restructuring, carbon market development and improved risk frameworks.76 Developed countries also have a role to play, by providing concessional finance, supporting risk-reducing instruments and promoting global climate finance initiatives. An example of such collaboration is Pentagreen Capital, launched by HSBC and Temasek, aimed at mobilizing over $1 billion for sustainable infrastructure in South-East Asia. Their financing of solar and bioenergy projects exemplifies how developed countries can provide essential capital and expertise to stimulate private sector investment in developing nations.77
While the costs of these initiatives may be significant, companies can offset some of these expenses by generating returns from decarbonization initiatives across multiple value levers.
– New markets: To increase profits, companies can use their core businesses to tap into new markets. For example, Maersk is actively developing both the supply and demand for green shipping fuels. By investing in a green ammonia facility with Danish logistics group DFDS and establishing a green methanol company, Maersk aligns its operations with carbon reduction goals while positioning itself to capture market share in a growing sector.78
– Premium pricing: Companies that identify opportunities for greener products can command premium prices, as green premiums are becoming more prevalent across various commodities. These premiums can offer added value to consumers by supporting sustainable choices, allowing companies to maintain industry margins with moderate adjustments in consumer prices. Economic factors, including inflation and rising living costs, are influencing the supply-demand balance in these markets. For instance, high-quality recycled plastics have achieved an average premium of up to 60% over virgin plastics in recent years. Similarly, low-CO2 steel is expected to command significant premiums by 2030.79
– Energy and material expense reduction: Companies that manage to reduce both their costs and carbon emissions can gain a bigger share of the market and save money for future projects aimed at reducing their environmental impact. Many industry leaders focus on cutting down their emissions by 20-40%. At the same time, they work on lowering their costs, which leads to higher profits.80
– Enhanced branding: Decarbonization enhances a company’s brand reputation, cultivating trust and loyalty among environmentally conscious consumers while differentiating it in the marketplace. By adopting transparent and genuine green practices, companies improve brand perception and customer loyalty, which can lead to increased sales and profitability.
Policy
Key readiness question
Are the supporting policies to enable the growth of low-emission industry in place?
Key messages
– Effective policies are essential for creating
an enabling environment to achieve the 2050 net-zero target.
– Decarbonization policies face challenges including increased costs, uneven global commitment, opposition from fossil fuel sectors and risks of carbon leakage.
– GHG emissions reduction policies can be classified into three main types: market-based, mandate-based and incentive-based.
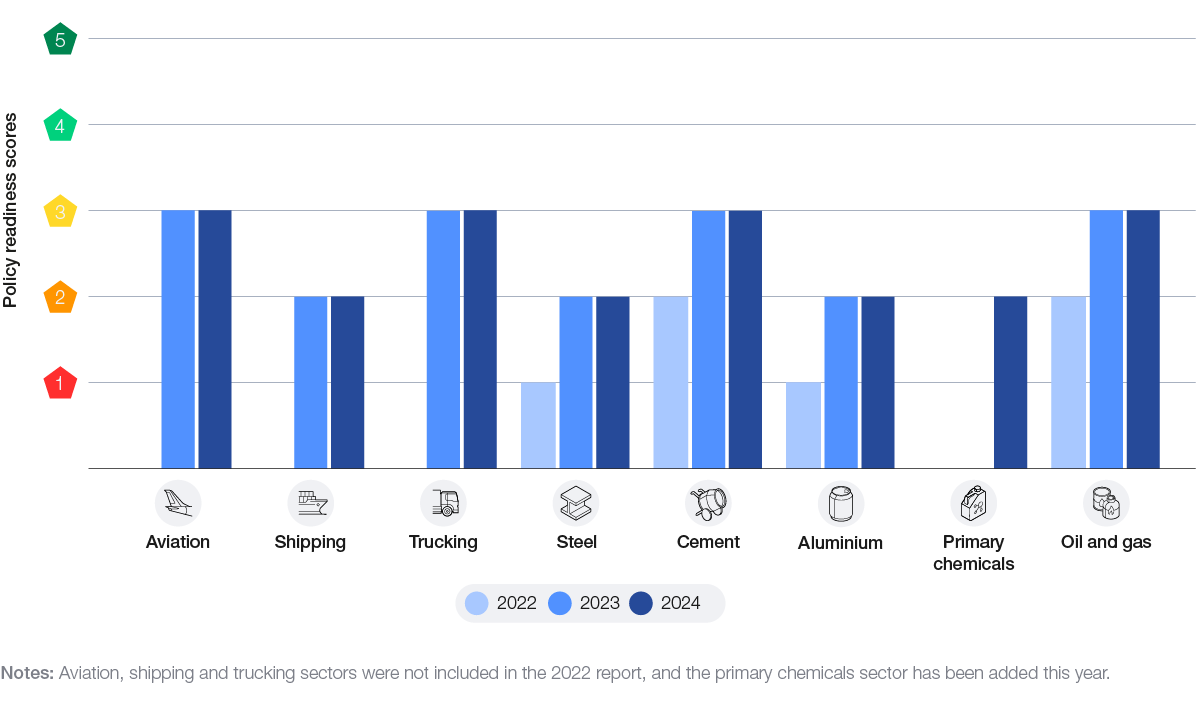
Figure 20: Policies scores supporting the growth of low-emission industry across sectors (2022-2024)
Sectors with readiness score movements in the past year:
The policy scores for all the sectors have remained stagnant since last year, due to no major developments in terms of sector-specific policies and regulations.
To achieve the global 2050 net-zero target, policies can help create an enabling environment for decarbonization and adoption of clean energy across industries.
Challenges
Decarbonization policies face several significant challenges, which vary depending on the region, industry and the specifics of the policy:
– Clean energy policies can, in some instances, raise costs for businesses and consumers, leading to social resistance and implementation difficulties.
– Uneven commitment to decarbonization across countries complicates coordinated efforts across global product value chains and can undermine national progress.
– Distributional effects on suppliers and workers in emissions-intensive industries can weaken policies aimed at reducing emissions.
– Regulatory arbitrage may drive businesses to relocate to less regulated regions, diminishing overall emission reduction efforts.
Way forward
Currently, the different policies on GHG emissions reduction are of three key types:
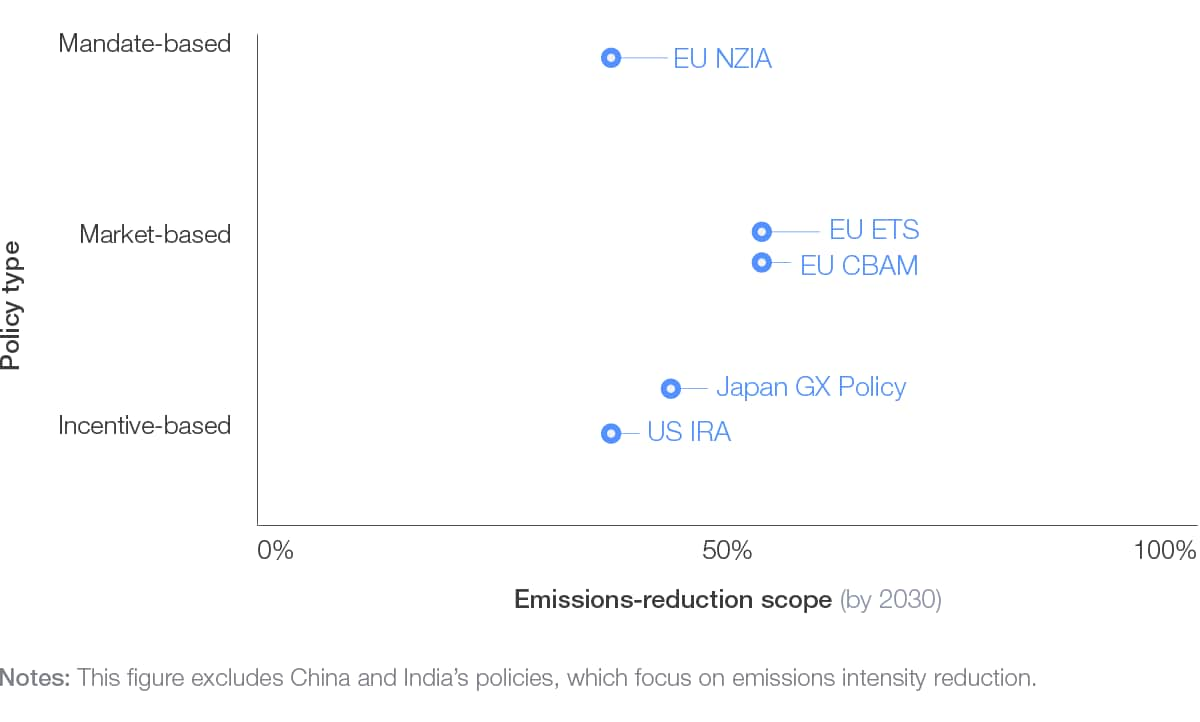
– Market-based: This type of policy involves the construction of systems that make the polluting entity incur a cost for their emissions. These systems can be carbon taxes, emissions limits or cap-and-trade programmes. The European Union’s (EU) Emission Trading Scheme (ETS)81 is an example of a market-based GHG emission reduction policy. This type of policy can be classified as a “push” policy because it pushes the industry to move away from emission-intensive practices. The EU ETS policy covers the steel, cement, chemicals, aviation and shipping sectors.
– Mandate-based: This type of policy involves the introduction of direct regulations or setting up of government targets for decarbonization initiatives such as installed capacity of specific types of clean energy. The EU’s Net Zero Industry Act (NZIA),82 China’s 14th Five Year Plan83 and India’s National Action Plan on Climate Change84 are examples of a mandate-based GHG emission reduction policy. This type of policy can also be classified as a “push” policy, since it pushes the industry to move away from emission-intensive practices.
– Incentive-based: This type of policy involves direct funding, tax credits or subsidies from the government to support decarbonization initiatives like increasing the production of clean energy or the development of low-emission technologies. The US Inflation Reduction Act (US IRA)85 and Japan’s Green Transformation (GX) Policy86 are examples of an incentive-based GHG emission reduction policy. This type of policy can be classified as a “pull” policy, as it pulls the industry towards low-emission practices.
Each policy type has specific objectives and covers key sectors and technologies. A balanced approach, combining push and pull strategies, can encourage long-term industry participation, providing pathways for sectors like transport and industrial sectors to decarbonize effectively.
Table 3: Policy summary
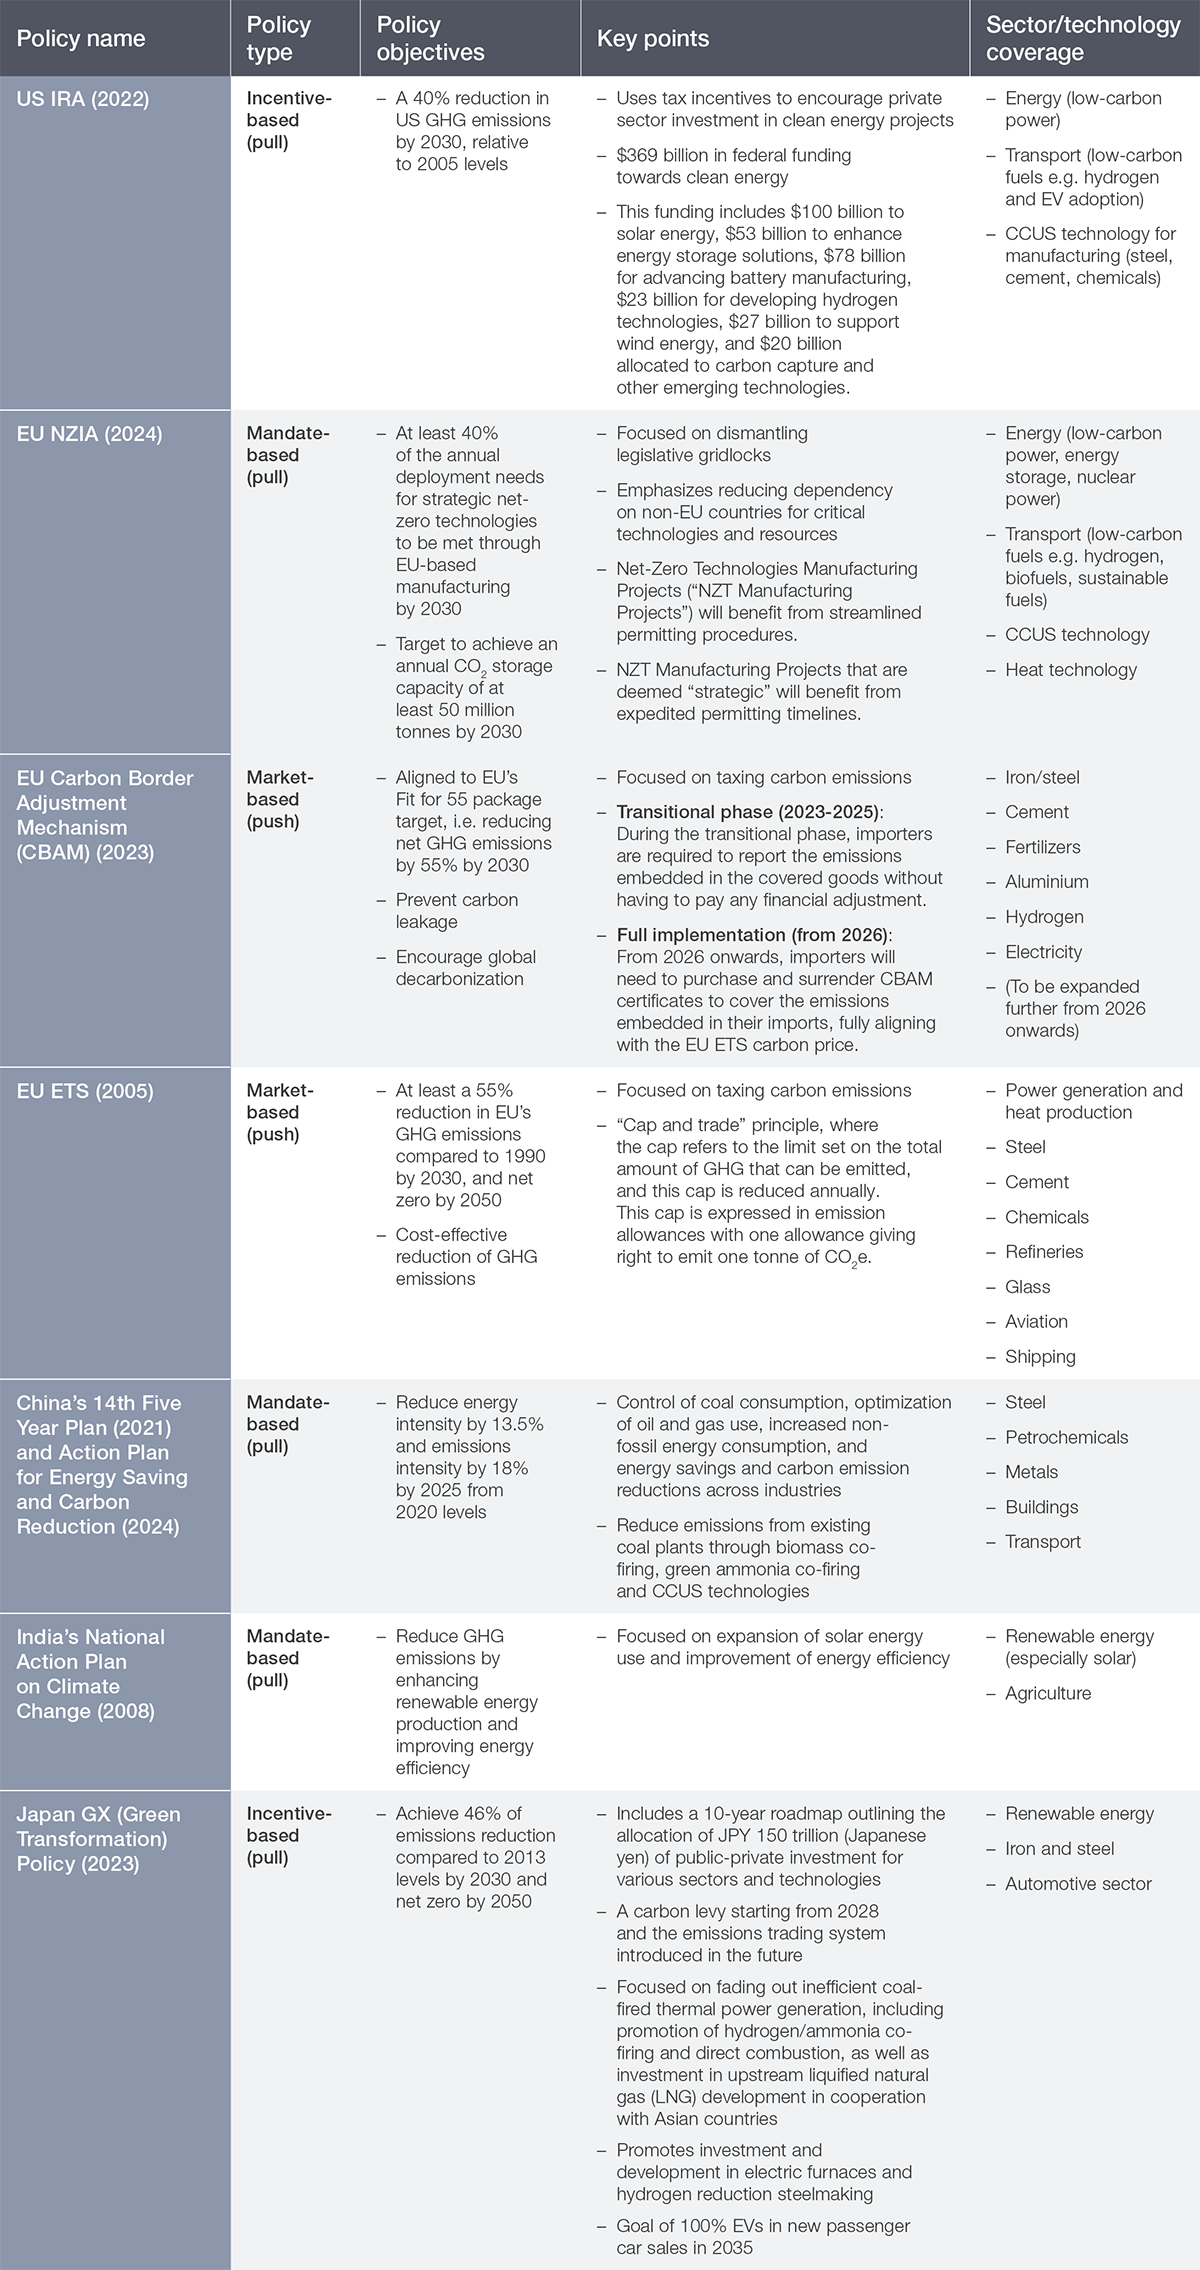
Figure 21: Comparison of key cross-sector policies
3.3 Key priorities
In the last year, while the eight hard-to-abate sectors in scope have seen some progress in terms of emissions intensity reduction, their efforts have led to limited movement in their readiness scores across the five readiness dimensions. Going forward, these sectors must accelerate efforts to reduce emissions intensity to achieve their respective net-zero ambitions by 2050. In order to increase momentum, the key stakeholders across these sectors must consider the following priorities as the main impact drivers, and explore areas of collaboration:
Figure 22: Key priorities for stakeholders impacting the transition for hard-to-abate sectors
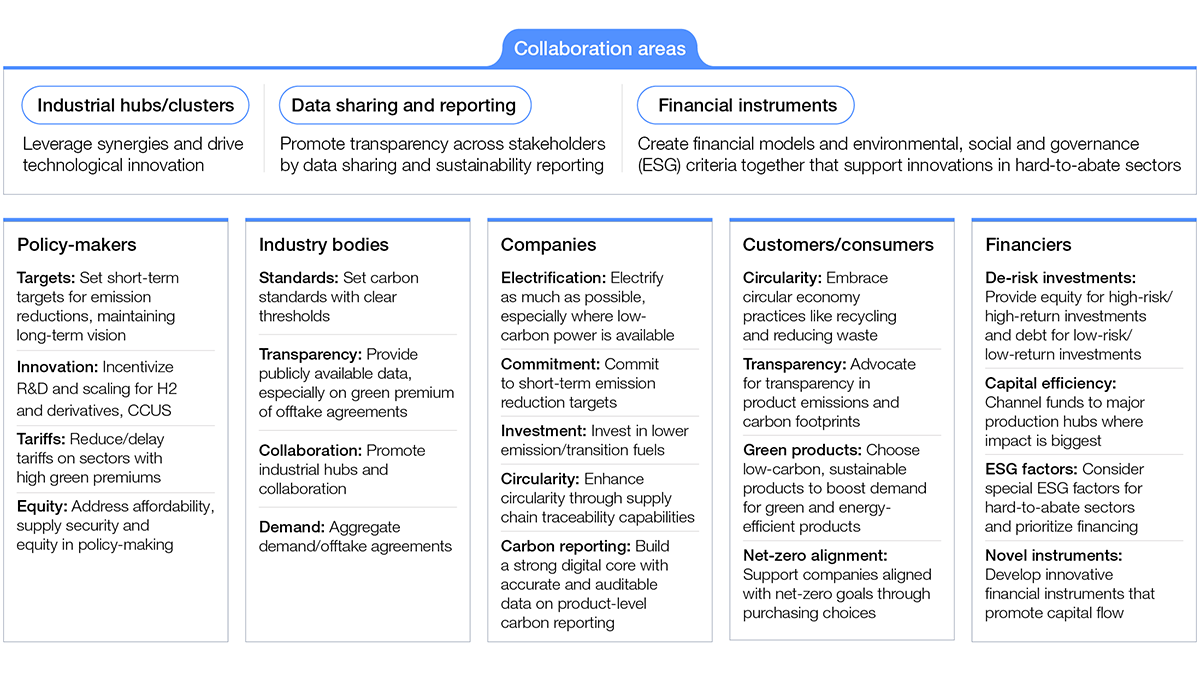
While collective efforts on these key areas of collaboration can potentially enable a faster transition to net zero, the implementation of sector-specific strategies will be critical for each of the hard-to-abate sectors to successfully achieve their net-zero ambitions by 2050.