We live in a world where people are living longer and the global demographic is changing. But what does this change actually look like?
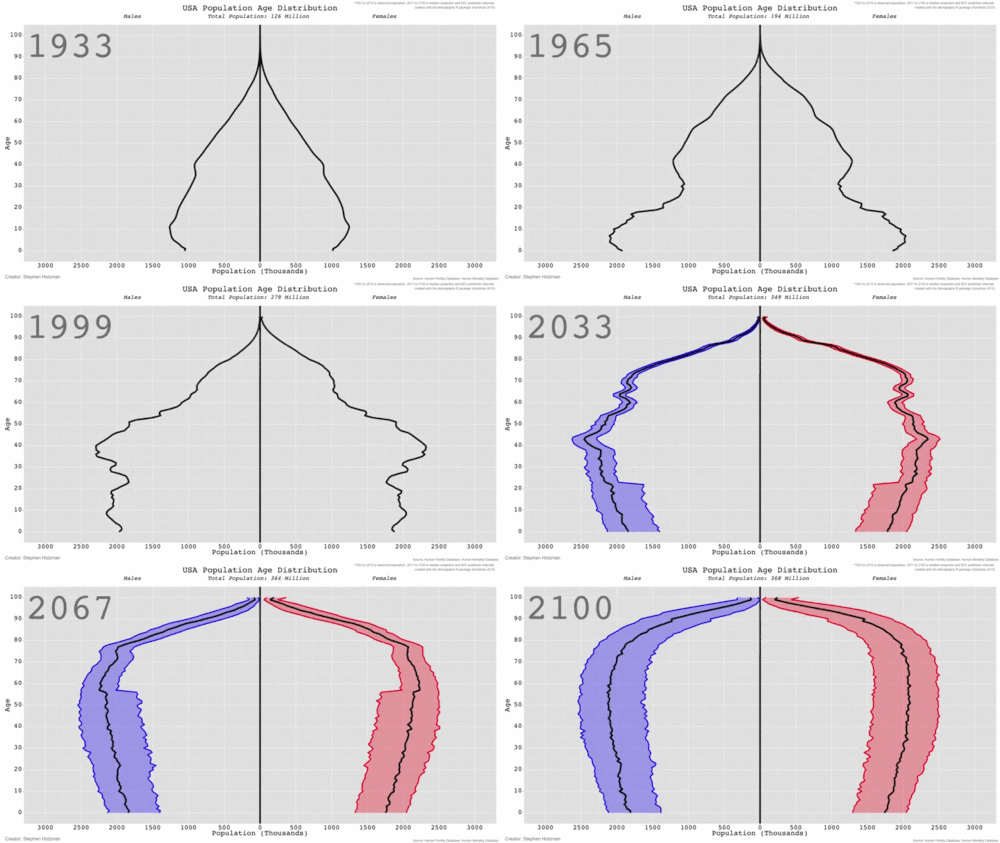
Reddit user Stephen Holzman wondered the same, and put together this visualization showing the US age distribution from 1933-2100. It offers a new way to understand an ageing population, putting into just a few seconds the long-term demographic changes going on around us.
As Mr Holzman explained: “A lot gets written about the ‘greying’ of the population, but it’s difficult to be enthusiastic about a process that takes decades. So I sped it up.”
Source: Stephen Holzman
What is it telling us?
The visualization shows us the age distribution of the US population from 1933 to 2100. Until 2010, the data is the observed and recorded demographic information, and from then until 2100 forecasts are used. These are taken from the Human Fertility and Human Mortality Databases.
On the left you can see the male population, while on the right is the female. Post 2010, the blue and red areas reflect the uncertainty ranges in these projections.
What is clear from the visualization is that we can expect to see a very different US demographic in 80 years’ time, compared to 1933. There will a much higher number of older people relative to young people. This is largely the result of the dramatic increase in the number of people over the age of 65.
Is this a problem?
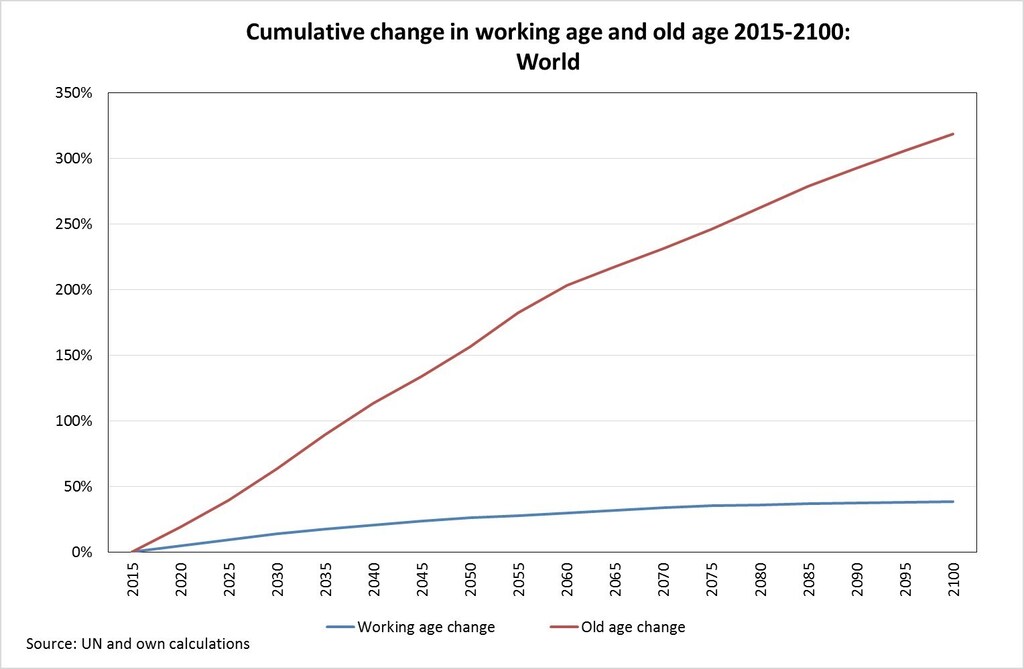
The potential consequences of an ageing population include economic pressure on healthcare and other welfare systems and a much smaller working-age population relative to the elderly.
Source: International Longevity Centre
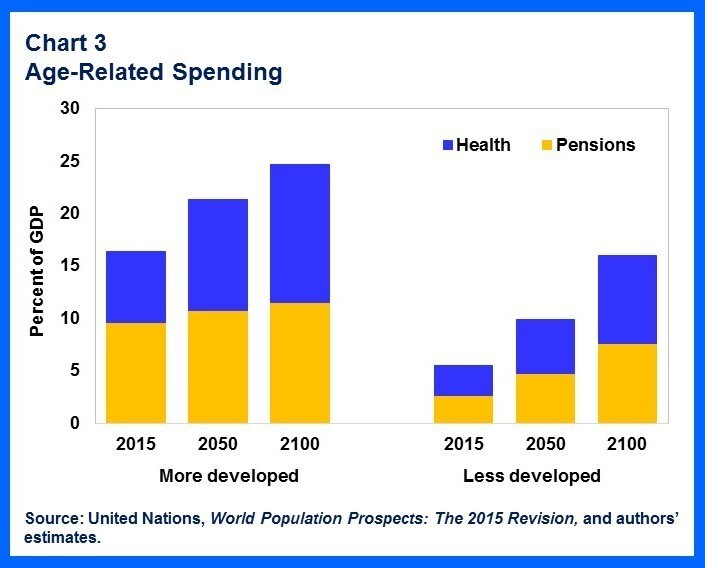
As this chart from the International Longevity Centre highlights, this is a global phenomenon. Simply put, this change could result in costs rising more quickly than tax revenues for governments around the world. This rise in spending is highlighted in the following chart from the IMF.
Source: IMF
“Turning 65 in 2016 doesn’t mean the same thing as hitting 65 in 1916”
Although an ageing population does present serious challenges, it might not be as bad as we think. We have to remember that as healthcare has advanced, what it meant to be 65 in 1916 (or 1933) is no longer the same as what it means to be 65 today. It has been argued that our measures of ageing are in fact themselves ageing. Failing to modernise these measures mean our forecasts of the results of this demographic change could be overly pessimistic.
As Mr Holzman’s visualisation shows us, this change is going on around us right now, so understanding the impact is vital if we are to respond effectively.
Have you read?
What are the economic implications of ageing populations?
How do we deal with ageing and shrinking populations?
Why the impact of ageing may not be as bad as we think
World Economic Forum Report: Global Population Ageing: Peril or Promise?