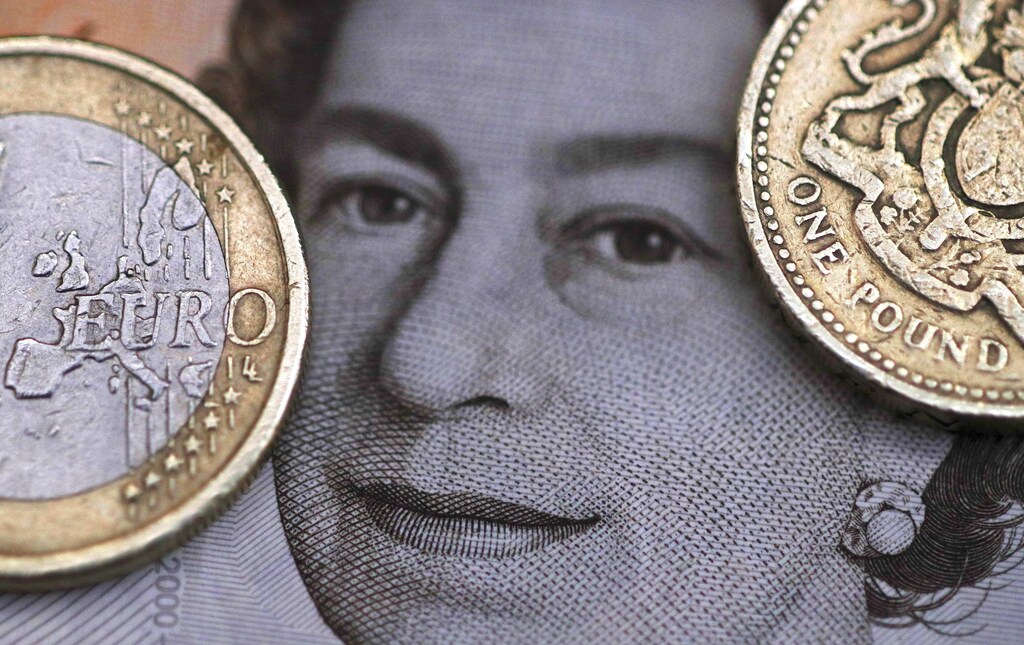
There’s really no other way to describe it.
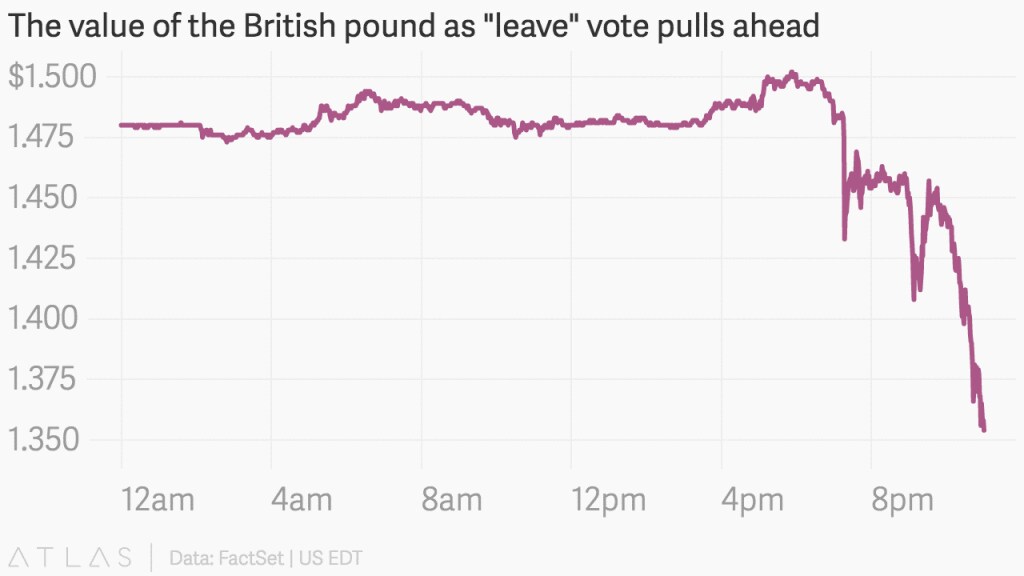
The United Kingdom’s pound sterling is enduring one of its worst-ever one-day declines, dropping by roughly 11% at points against the US dollar early this morning (June 24).
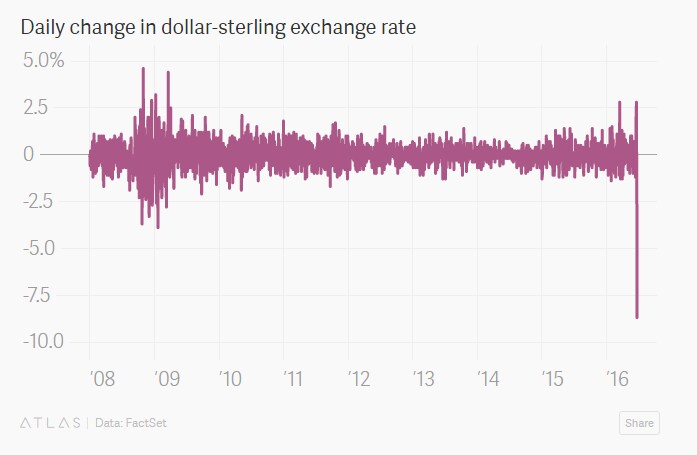
This chart gives you a sense of exactly how insane an outlier the size of today’s decline is.
This chart gives you a sense of exactly how insane an outlier the size of today’s decline is.
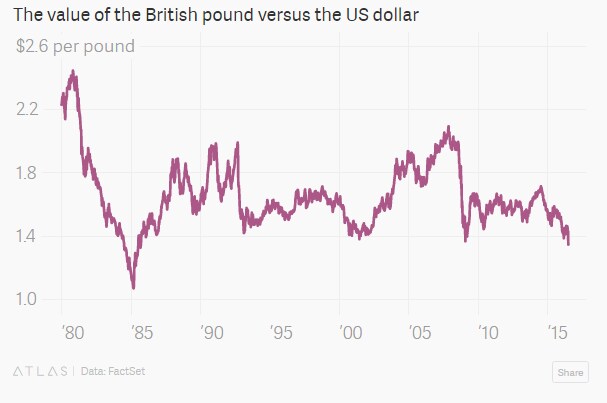
The sharp drop brings the pound back to levels last seen in the mid-1980s.
There’s no secret about why either. Britain’s referendum decision to leave the European Union throws a large pall of uncertainty over the British economy. A British exit from the EU would throw scores of trade deals into doubt and could potentially disrupt the economy for some time to come.
Since demand for a nation’s currency reflects global demand to trade and invest in that country, the sharp downturn in the pound is a sign that the world economy expects to do far less business in Britain in light of the vote.