Income inequality has been a hot-button issue globally in 2016, and with good reason. A new report confirms that the world’s rich do, indeed, keep getting richer.
According to researchers from Credit Suisse, the richest 1% owned 50.8% of the world’s wealth in 2016, up from 45.4% in 2009. Zoom out to the wealthiest 10% of the world’s adult population, and together they hold 89% of all global assets.
“In recent years, there has been a growing sense that the economic recovery is shallow, and has not reached all layers of society. Evidence from our global wealth database supports this view,” Credit Suisse researchers wrote.
Some 73% of the world’s adults have less than $10,000 in wealth, accounting for 2.4% of global wealth. And half the world’s adult population owns less than $2,222.
But there may be some hope for the least wealthy in the world, says Michael O’Sullivan, chief investment officer for Credit Suisse’s wealth management division. He notes that while the bottom 73% mostly live in places like Congo or Nigeria, some are actually increasing their wealth at a greater clip than in other parts of the world.
“These countries are interesting because the rate of change for many households is actually very rapid,” says O’Sullivan. “And if I think back to what happened in Indonesia for the last 15 years, where wealth has increased by six times in that period, you look at some of the African countries and wonder whether the same is possible?”
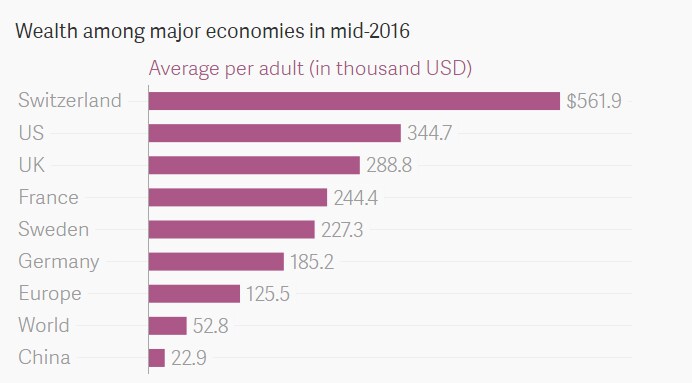
Overall, the increase in wealth worldwide last year kept pace with population growth, growing by just 1.4% to $256 trillion. The United States and Japan fared better than most countries. The US saw its eighth successive year of rising wealth, boasting an average net wealth per household of $344,700. Currency appreciation boosted Japan’s wealth by 19% in 2016.
Credit Suisse’s analysis of wealth in the US is consistent with what is happening to median incomes in the country. In 2015, the median household income for Americans was $56,500, an increase of more than 5% from the previous year, when adjusted for inflation. As the Credit Suisse researchers note, wealth per adult in the US has recovered from the severe hits taken during the 2008 financial crisis—and then some. The stat is 19% above the level it was in 2006. Of course, the concentration of extreme wealth in the US certainly helps the average: 41% of the world’s millionaires live in the US.
The biggest loser in 2016, by far, was the United Kingdom. When the British pound crashed in the wake of Brexit, the UK lost $1.5 trillion of its wealth. The net average wealth per household in the UK fell by $33,000 from the previous year. But the UK remains in the top three countries as ranked by average wealth per adult.