There tends to be a relationship between a country's wealth and its performance at the Olympics, with wealthier countries generally winning more medals than poorer countries. Despite that, the 2016 Rio Olympics saw some countries punching above their economic weight.
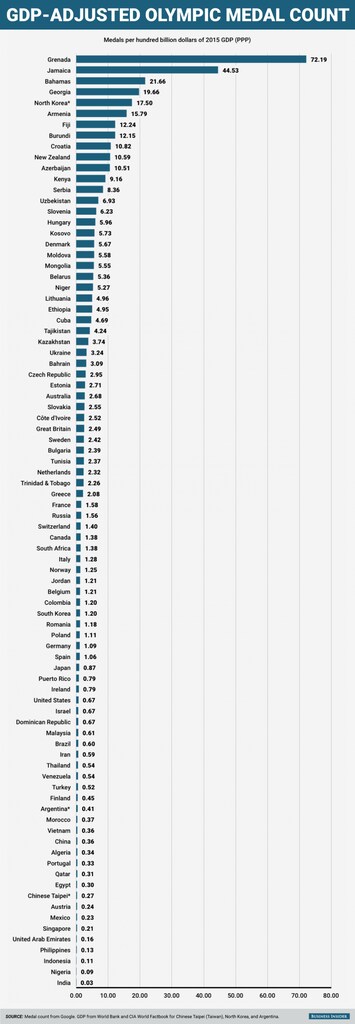
Using the final medal count from the Games compiled by Google, along with 2015 GDP figures adjusted by "purchasing power parity" (PPP) that accounts for the different cost of living in different countries from the World Bank and CIA World Factbook, we determined the number of medals each country won per $100 billion of GDP.
The Caribbean island nation of Grenada came in first, as it did when we looked at a population-adjusted medal count, winning a single silver medal while having a GDP of only about $1.4 billion. The United States, which came in first place in the overall medal count, was just 60th on the GDP-adjusted measure out of the 86 countries that won at least one medal.
Here's the GDP-adjusted medal count:
Have you read?
Adjusting for population, these were the most successful countries at the Rio Olympics
This stunning animation resizes US counties based on their contribution to GDP